- Phân tích
- Tin tức và các công cụ
- Tin tức thị trường
- Silver Price Analysis: XAG/USD rebounds as bulls target $29.00
Silver Price Analysis: XAG/USD rebounds as bulls target $29.00
- Silver stages a comeback, trading at $29.00 with gains of 0.83% after yesterday's 0.46% loss.
- RSI shows bearish momentum, indicating possible extended losses.
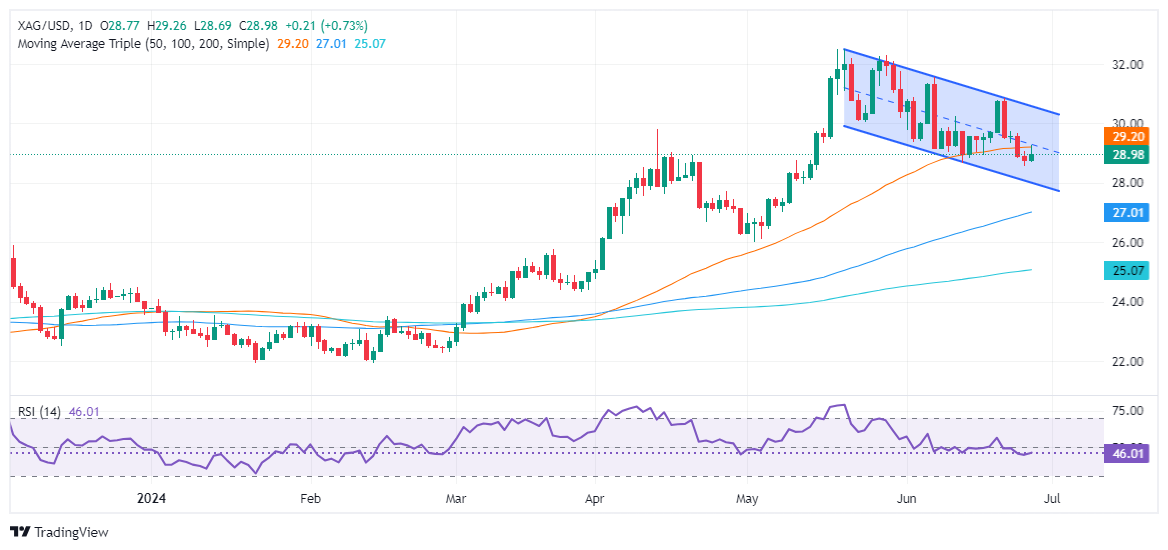
- Support levels: $28.28 (June 10 high), $28.00, $27.01 (May 8 low), $26.82 (100-DMA).
- Resistance points: $29.00, $29.17 (50-DMA), $31.54 (June 7 high), $32.00, $32.51 (YTD high).
Silver price stages a comeback on Thursday and erases yesterday’s losses of 0.46%. It trades near the crucial $29.00 psychological level and registers gains of 0.83% at the time of writing.
XAG/USD Price Analysis: Technical outlook
Silver’s price action during the last couple of days formed a quasi ‘tweezers bottom’ candle chart, yet it remains trading within a descending channel, spurred by last week's ‘bearish engulfing’ chart pattern formation, that exacerbated the grey’s metal downtrend.
Momentum support sellers, as measured by the Relative Strength Index (RSI), standing at bearish territory, hinting the grey metal could extend its losses.
Therefore, XAG/USD's first support is the June 10, 2021, high at $28.28. A breach of the latter will expose the psychological $28.00 mark, followed by the May 8 swing low of $27.01, ahead of the 100-DMA at $26.82.
Conversely, if XAG/USD reclaims the $29.00 figure, the next resistance level would be the 50-day moving average (DMA) at $29.17. Once hurdle, the next level would be the June 7 high of $31.54. Clearing this would aim for $32.00 before challenging the year-to-date (YTD) high of $32.51.
XAG/USD Price Action – Daily Chart
US Dollar PRICE Today
The table below shows the percentage change of US Dollar (USD) against listed major currencies today. US Dollar was the strongest against the New Zealand Dollar.
| USD | EUR | GBP | JPY | CAD | AUD | NZD | CHF | |
|---|---|---|---|---|---|---|---|---|
| USD | -0.01% | -0.02% | -0.03% | -0.02% | -0.00% | 0.01% | -0.00% | |
| EUR | 0.01% | -0.00% | -0.02% | -0.00% | -0.01% | 0.02% | 0.00% | |
| GBP | 0.02% | 0.00% | -0.02% | -0.02% | 0.00% | 0.02% | -0.02% | |
| JPY | 0.03% | 0.02% | 0.02% | -0.03% | 0.01% | -0.01% | 0.02% | |
| CAD | 0.02% | 0.00% | 0.02% | 0.03% | 0.00% | 0.01% | -0.01% | |
| AUD | 0.00% | 0.00% | -0.00% | -0.01% | -0.00% | 0.02% | 0.02% | |
| NZD | -0.01% | -0.02% | -0.02% | 0.00% | -0.01% | -0.02% | -0.03% | |
| CHF | 0.00% | -0.00% | 0.02% | -0.02% | 0.00% | -0.02% | 0.03% |
The heat map shows percentage changes of major currencies against each other. The base currency is picked from the left column, while the quote currency is picked from the top row. For example, if you pick the US Dollar from the left column and move along the horizontal line to the Japanese Yen, the percentage change displayed in the box will represent USD (base)/JPY (quote).


© 2000-2026. Bản quyền Teletrade.
Trang web này được quản lý bởi Teletrade D.J. LLC 2351 LLC 2022 (Euro House, Richmond Hill Road, Kingstown, VC0100, St. Vincent and the Grenadines).
Thông tin trên trang web không phải là cơ sở để đưa ra quyết định đầu tư và chỉ được cung cấp cho mục đích làm quen.
Giao dịch trên thị trường tài chính (đặc biệt là giao dịch sử dụng các công cụ biên) mở ra những cơ hội lớn và tạo điều kiện cho các nhà đầu tư sẵn sàng mạo hiểm để thu lợi nhuận, tuy nhiên nó mang trong mình nguy cơ rủi ro khá cao. Chính vì vậy trước khi tiến hành giao dịch cần phải xem xét mọi mặt vấn đề chấp nhận tiến hành giao dịch cụ thể xét theo quan điểm của nguồn lực tài chính sẵn có và mức độ am hiểu thị trường tài chính.
Sử dụng thông tin: sử dụng toàn bộ hay riêng biệt các dữ liệu trên trang web của công ty TeleTrade như một nguồn cung cấp thông tin nhất định. Việc sử dụng tư liệu từ trang web cần kèm theo liên kết đến trang teletrade.vn. Việc tự động thu thập số liệu cũng như thông tin từ trang web TeleTrade đều không được phép.
Xin vui lòng liên hệ với pr@teletrade.global nếu có câu hỏi.
ngân hàng