- Phân tích
- Tin tức và các công cụ
- Tin tức thị trường
- Silver Price Analysis: XAG/USD tumbles and remains bearish below $29.00
Silver Price Analysis: XAG/USD tumbles and remains bearish below $29.00
- Silver drops influenced by Fed's Core PCE Price Index anticipation.
- Last week's bearish engulfing pattern and RSI hint at more declines.
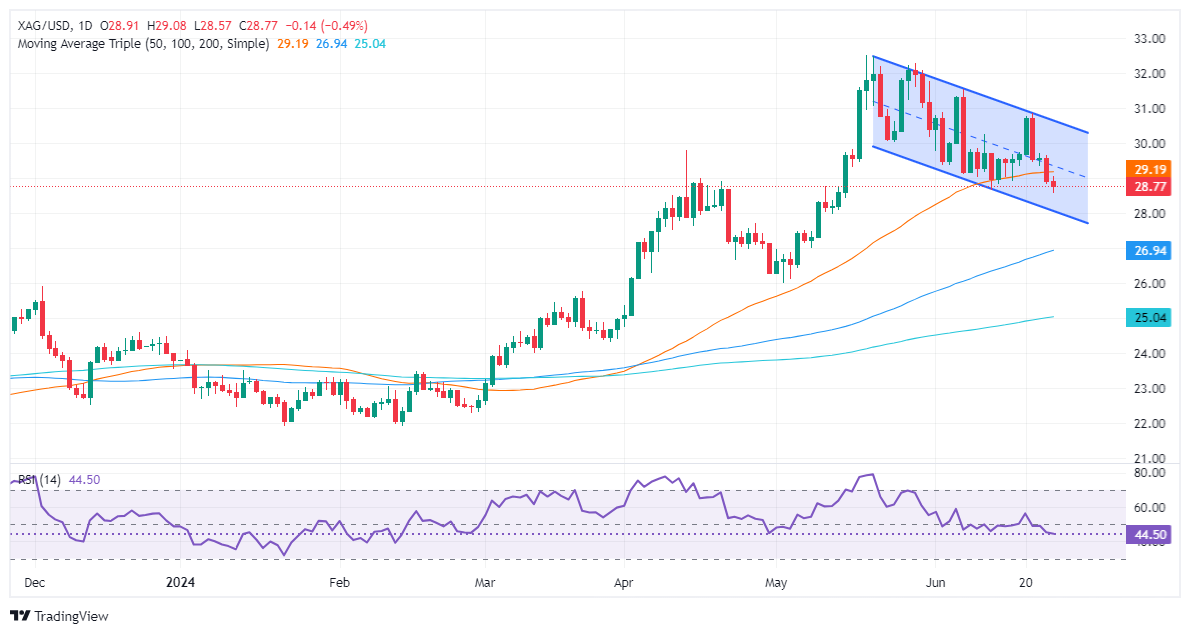
- Support levels: $28.28 (June 10 high), $28.00, $27.01 (May 8 low), $26.82 (100-DMA).
- Resistance points: $29.17 (50-DMA), $31.54 (June 7 high), $32.00, $32.51 (YTD high).
Silver price fell on Wednesday as market participants awaited the release of the Fed’s preferred inflation gauge, the core Personal Consumption Expenditure (PCE) Price Index, after releases from major countries hinted at a reacceleration of inflation. The XAG/USD spot price is at $28.76, down by 0.46%.
XAG/USD Price Analysis: Technical outlook
The grey metal formed a ‘bearish engulfing’ chart pattern last week, indicating potential for further downside. Momentum support sellers, as measured by the bearish Relative Strength Index (RSI), suggest that silver could extend its losses.
Therefore, XAG/USD's first support is the June 10, 2021, high at $28.28. A breach of the latter will expose the psychological $28.00 mark, followed by the May 8 swing low of $27.01, ahead of the 100-DMA at $26.82.
Conversely, if XAG/USD resumes its uptrend, the next resistance level would be the 50-day moving average (DMA) at $29.17. Surpassing this level would target the June 7 high of $31.54. Clearing this would aim for $32.00 before challenging the year-to-date (YTD) high of $32.51.
XAG/USD Price Action – Daily Chart


© 2000-2026. Bản quyền Teletrade.
Trang web này được quản lý bởi Teletrade D.J. LLC 2351 LLC 2022 (Euro House, Richmond Hill Road, Kingstown, VC0100, St. Vincent and the Grenadines).
Thông tin trên trang web không phải là cơ sở để đưa ra quyết định đầu tư và chỉ được cung cấp cho mục đích làm quen.
Giao dịch trên thị trường tài chính (đặc biệt là giao dịch sử dụng các công cụ biên) mở ra những cơ hội lớn và tạo điều kiện cho các nhà đầu tư sẵn sàng mạo hiểm để thu lợi nhuận, tuy nhiên nó mang trong mình nguy cơ rủi ro khá cao. Chính vì vậy trước khi tiến hành giao dịch cần phải xem xét mọi mặt vấn đề chấp nhận tiến hành giao dịch cụ thể xét theo quan điểm của nguồn lực tài chính sẵn có và mức độ am hiểu thị trường tài chính.
Sử dụng thông tin: sử dụng toàn bộ hay riêng biệt các dữ liệu trên trang web của công ty TeleTrade như một nguồn cung cấp thông tin nhất định. Việc sử dụng tư liệu từ trang web cần kèm theo liên kết đến trang teletrade.vn. Việc tự động thu thập số liệu cũng như thông tin từ trang web TeleTrade đều không được phép.
Xin vui lòng liên hệ với pr@teletrade.global nếu có câu hỏi.
ngân hàng