- Phân tích
- Tin tức và các công cụ
- Tin tức thị trường
- USD/JPY Price Analysis: Hits 38-year high at around 160.80s
USD/JPY Price Analysis: Hits 38-year high at around 160.80s
- USD/JPY reaches multi-year peak at 160.83, surpassing key 160.00 level amid USD strength.
- Technicals show strong uptrend with overbought RSI, buying momentum strong.
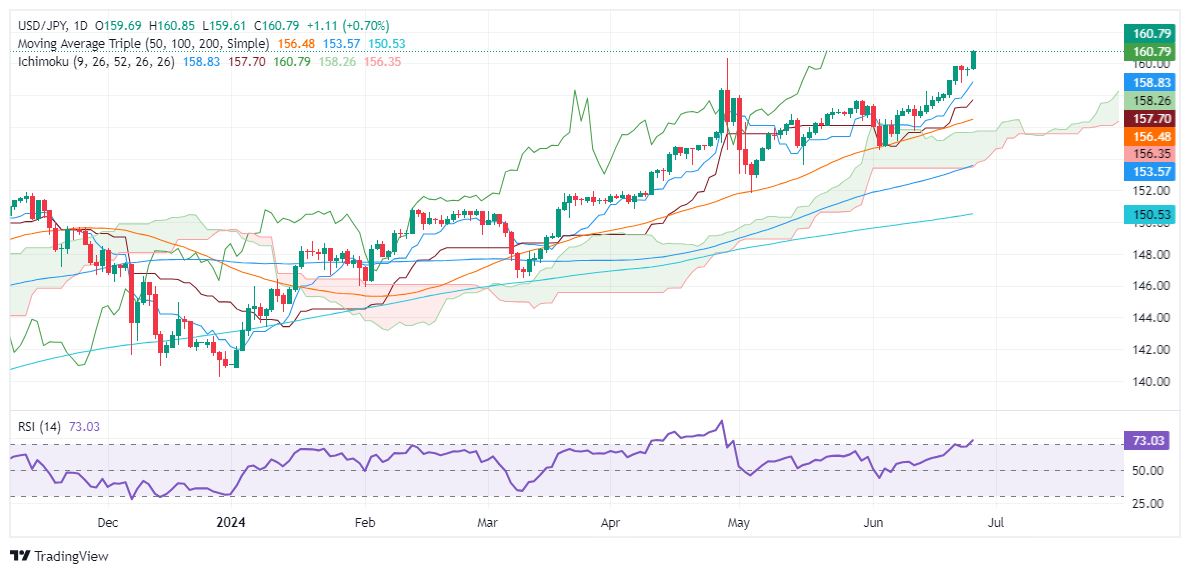
- Resistance levels: 161.00, 162.00, 164.87 (Nov 1986 high), 178 (Apr 1986 high).
- Support found at 158.75 (June 24 low), Tenkan-Sen at 157.82, Senkou Span A at 157.53, Kijun-Sen at 157.24.
The USD/JPY rallied sharply during Wednesday’s session after the pair hit a 38-year high past the 160.00 psychological figure, seen as the line of the sand for Japanese authorities and the Japanese Yen to intervene in the FX space. Nevertheless, failure to do it prompted US dollar bulls to push the exchange rate higher, and at the time of writing, the pair traded at 160.83, which was up 0.73%.
USD/JPY Price Analysis: Technical outlook
The USD/JPY is upward biased and extended its gains past the psychological 160.00 barrier for the second time since April 29, when the pair printed a year-to-date (YTD) high of 160.32. This has reignited fears that Japanese authorities or the Bank of Japan (BoJ) could step into the plate to halt Yen’s depreciation.
Momentum favors buyers, with the Relative Strength Index (RSI) at overbought conditions. However, due to the strength of the uptrend, most technicians use 80 as “extreme” overextended conditions.
The next resistance would be the psychological levels of 161.00, 162.00, and so forth, ahead of testing November’s 1986 high of 164.87, followed by April's 1986 high of 178.
Conversely, if USD/JPY drops below 160.00, the first support would be June’s 24 low of 158.75, followed by the Tenkan-Sen at 157.82. Once those levels are cleared, the next stop would be the Senkou Span A at 157.53, and then the Kijun-Sen at 157.24.
USD/JPY Price Action – Daily Chart


© 2000-2026. Bản quyền Teletrade.
Trang web này được quản lý bởi Teletrade D.J. LLC 2351 LLC 2022 (Euro House, Richmond Hill Road, Kingstown, VC0100, St. Vincent and the Grenadines).
Thông tin trên trang web không phải là cơ sở để đưa ra quyết định đầu tư và chỉ được cung cấp cho mục đích làm quen.
Giao dịch trên thị trường tài chính (đặc biệt là giao dịch sử dụng các công cụ biên) mở ra những cơ hội lớn và tạo điều kiện cho các nhà đầu tư sẵn sàng mạo hiểm để thu lợi nhuận, tuy nhiên nó mang trong mình nguy cơ rủi ro khá cao. Chính vì vậy trước khi tiến hành giao dịch cần phải xem xét mọi mặt vấn đề chấp nhận tiến hành giao dịch cụ thể xét theo quan điểm của nguồn lực tài chính sẵn có và mức độ am hiểu thị trường tài chính.
Sử dụng thông tin: sử dụng toàn bộ hay riêng biệt các dữ liệu trên trang web của công ty TeleTrade như một nguồn cung cấp thông tin nhất định. Việc sử dụng tư liệu từ trang web cần kèm theo liên kết đến trang teletrade.vn. Việc tự động thu thập số liệu cũng như thông tin từ trang web TeleTrade đều không được phép.
Xin vui lòng liên hệ với pr@teletrade.global nếu có câu hỏi.
ngân hàng