- Phân tích
- Tin tức và các công cụ
- Tin tức thị trường
- EUR/USD Price Analysis: Falls to near 1.0700 before a throwback support
EUR/USD Price Analysis: Falls to near 1.0700 before a throwback support
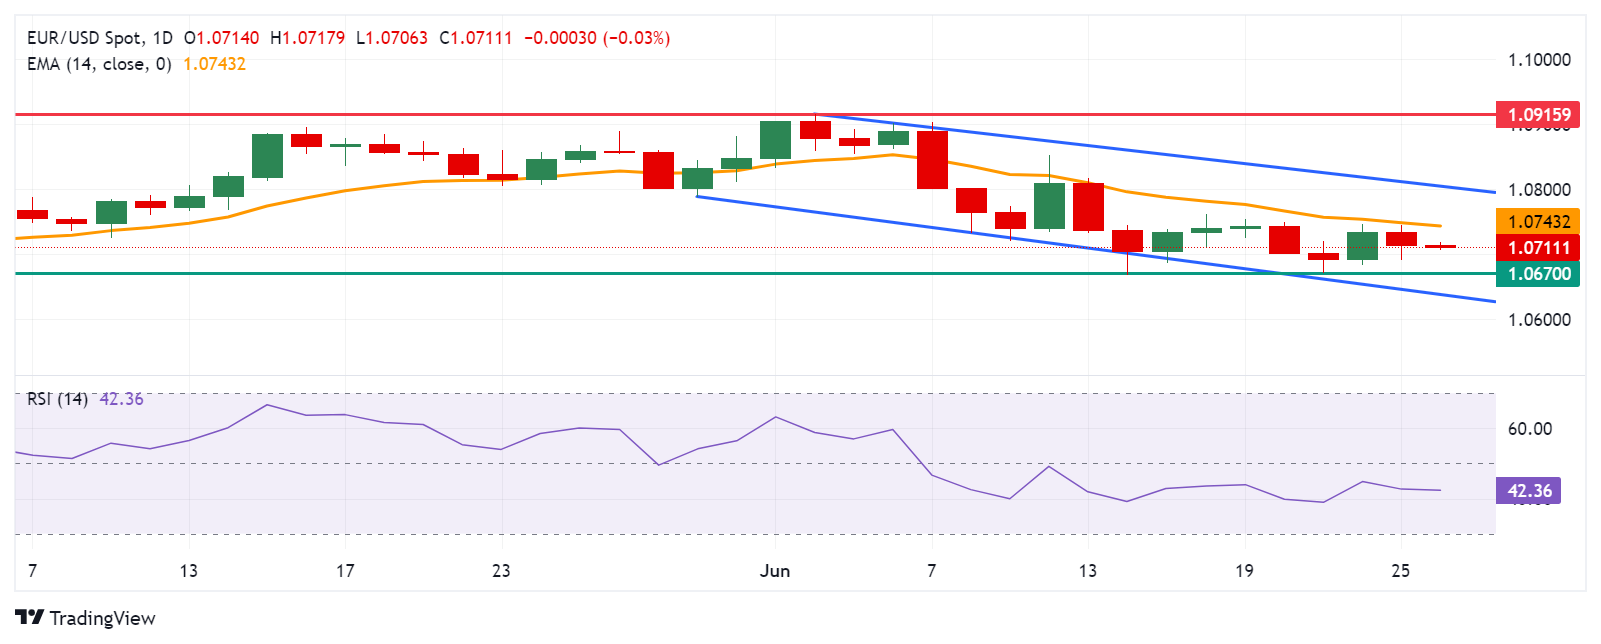
- The EUR/USD pair could test a throwback support at the 1.0670 level.
- The daily chart suggests a bearish bias as the pair consolidates within the descending channel.
- The immediate resistance appears at the 14-day EMA at the level of 1.0743.
EUR/USD extends its losses for the second consecutive day, trading around 1.0710 during the Asian session on Wednesday. A technical analysis of a daily chart suggests a bearish bias for the pair, as it consolidates within the descending channel.
Additionally, the momentum indicator 14-day Relative Strength Index (RSI) is positioned below the 50 level, suggesting a confirmation of a bearish bias for the EUR/USD pair.
The EUR/USD pair could find immediate support at the psychological level of 1.0700. A break below this level could exert downward pressure on the pair to test the throwback support at the level of 1.0670.
Further decline would strengthen the bearish bias and the pair could navigate the region around the lower boundary of the descending channel near the 1.0640 level.
On the upside, the EUR/USD pair could meet the immediate barrier at the 14-day Exponential Moving Average (EMA) at the level of 1.0743. A breakthrough above this level could lead the pair to test the area around the psychological level of 1.0800 and the upper boundary of the descending channel nearing the level of 1.0810.
Further resistance appears at the vicinity of the significant level of 1.0900 and a three-month high at 1.0915, which was recorded on June 4.
EUR/USD: Daily Chart


© 2000-2026. Bản quyền Teletrade.
Trang web này được quản lý bởi Teletrade D.J. LLC 2351 LLC 2022 (Euro House, Richmond Hill Road, Kingstown, VC0100, St. Vincent and the Grenadines).
Thông tin trên trang web không phải là cơ sở để đưa ra quyết định đầu tư và chỉ được cung cấp cho mục đích làm quen.
Giao dịch trên thị trường tài chính (đặc biệt là giao dịch sử dụng các công cụ biên) mở ra những cơ hội lớn và tạo điều kiện cho các nhà đầu tư sẵn sàng mạo hiểm để thu lợi nhuận, tuy nhiên nó mang trong mình nguy cơ rủi ro khá cao. Chính vì vậy trước khi tiến hành giao dịch cần phải xem xét mọi mặt vấn đề chấp nhận tiến hành giao dịch cụ thể xét theo quan điểm của nguồn lực tài chính sẵn có và mức độ am hiểu thị trường tài chính.
Sử dụng thông tin: sử dụng toàn bộ hay riêng biệt các dữ liệu trên trang web của công ty TeleTrade như một nguồn cung cấp thông tin nhất định. Việc sử dụng tư liệu từ trang web cần kèm theo liên kết đến trang teletrade.vn. Việc tự động thu thập số liệu cũng như thông tin từ trang web TeleTrade đều không được phép.
Xin vui lòng liên hệ với pr@teletrade.global nếu có câu hỏi.
ngân hàng