- Phân tích
- Tin tức và các công cụ
- Tin tức thị trường
- NZD/USD Price Analysis: Kiwi trades sideways, outlook hinges on SMA convergence
NZD/USD Price Analysis: Kiwi trades sideways, outlook hinges on SMA convergence
- NZD/USD moved sideways with mild losses while pair remains under the 20-day SMA.
- The Kiwi's outlook continues to skew bearish in the short term while the 100 and 200-day SMAs converge at 0.6070 potentially brightening the broader picture.
- Despite the bearish sentiment, a break above 0.6150, the position of the 20-day SMA, would change direction.
On Tuesday, the NZD/USD continues to trade sideways with minor losses. Sellers have consolidated their stance and taken the pair under the 20-day Simple Moving Average (SMA). Despite this, the convergence of the 100 and 200-day SMAs at 0.6070 could paint a more optimistic picture if they complete a bullish crossover.
The Relative Strength Index (RSI) on the daily chart fell to 49, suggesting more bearishness. Still, despite the downward shift, the RSI remains near the neutral zone. The Moving Average Convergence Divergence (MACD) remains flat with red bars, showcasing a seller's market.
NZD/USD daily chart
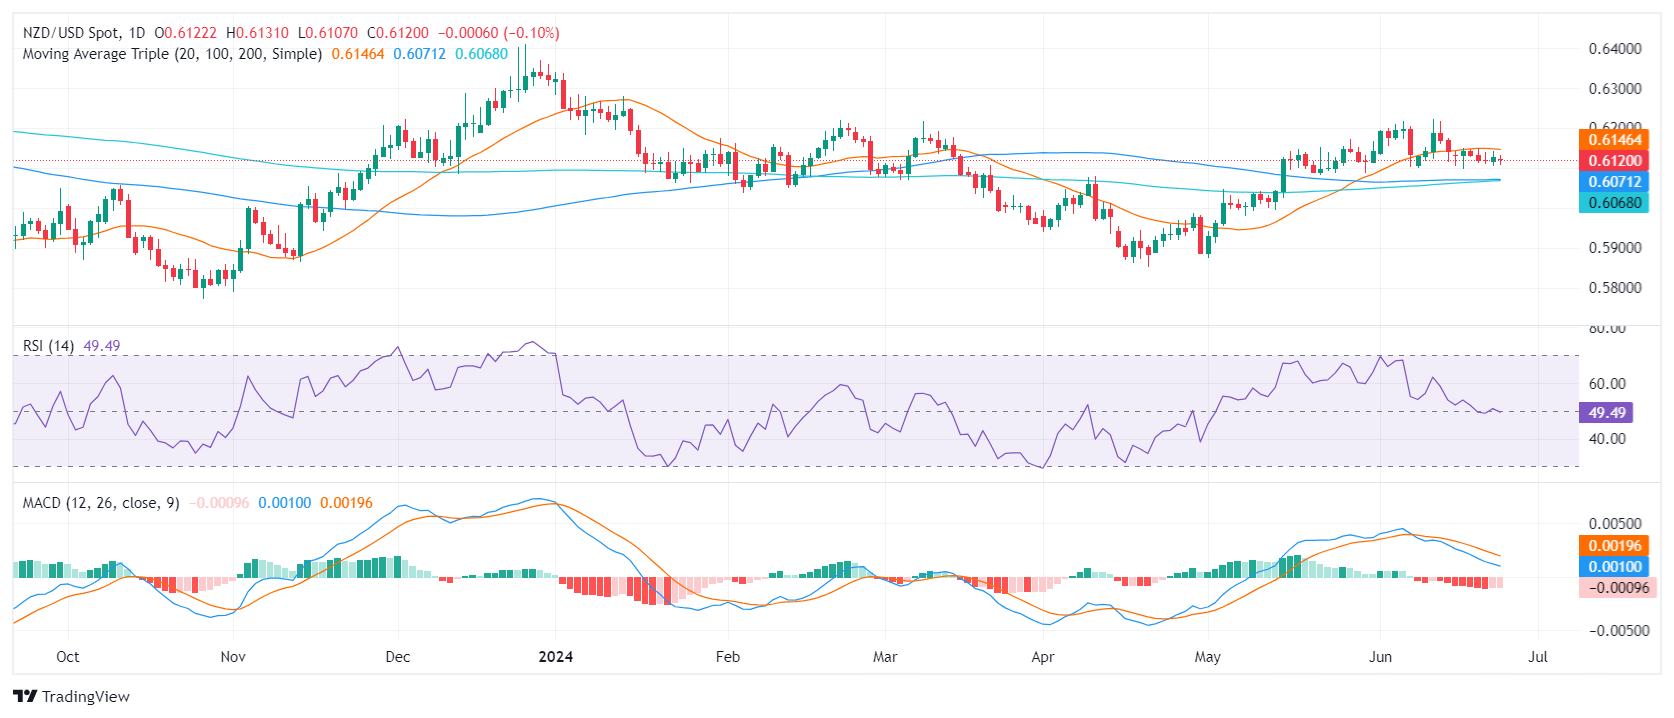
The NZD/USD finds immediate support near the 0.6100 level. Beneath that, additional support is available at the converging 100 and 200-day SMAs at 0.6070. If the pair continues its descent, these levels could provide a robust defense. A failure to hold these SMAs could signal a deepening of the sell-off scenario.
Conversely, resistance remains at the 20-day SMA at 0.6150, with additional resistance points at 0.6170 and 0.6200. A decisive breakout above these levels might indicate an end to the current bearish market sentiment and a shift in favor of the bulls.


© 2000-2026. Bản quyền Teletrade.
Trang web này được quản lý bởi Teletrade D.J. LLC 2351 LLC 2022 (Euro House, Richmond Hill Road, Kingstown, VC0100, St. Vincent and the Grenadines).
Thông tin trên trang web không phải là cơ sở để đưa ra quyết định đầu tư và chỉ được cung cấp cho mục đích làm quen.
Giao dịch trên thị trường tài chính (đặc biệt là giao dịch sử dụng các công cụ biên) mở ra những cơ hội lớn và tạo điều kiện cho các nhà đầu tư sẵn sàng mạo hiểm để thu lợi nhuận, tuy nhiên nó mang trong mình nguy cơ rủi ro khá cao. Chính vì vậy trước khi tiến hành giao dịch cần phải xem xét mọi mặt vấn đề chấp nhận tiến hành giao dịch cụ thể xét theo quan điểm của nguồn lực tài chính sẵn có và mức độ am hiểu thị trường tài chính.
Sử dụng thông tin: sử dụng toàn bộ hay riêng biệt các dữ liệu trên trang web của công ty TeleTrade như một nguồn cung cấp thông tin nhất định. Việc sử dụng tư liệu từ trang web cần kèm theo liên kết đến trang teletrade.vn. Việc tự động thu thập số liệu cũng như thông tin từ trang web TeleTrade đều không được phép.
Xin vui lòng liên hệ với pr@teletrade.global nếu có câu hỏi.
ngân hàng