- Phân tích
- Tin tức và các công cụ
- Tin tức thị trường
- GBP/USD Price Analysis: Stays firm below 1.2700, bearishly biased
GBP/USD Price Analysis: Stays firm below 1.2700, bearishly biased
- GBP/USD is steady as worse-than-expected US Consumer Confidence report, weighs on US Dollar.
- Technical outlook shows a 'bullish piercing' pattern, but momentum favors sellers, with RSI standing bearish.
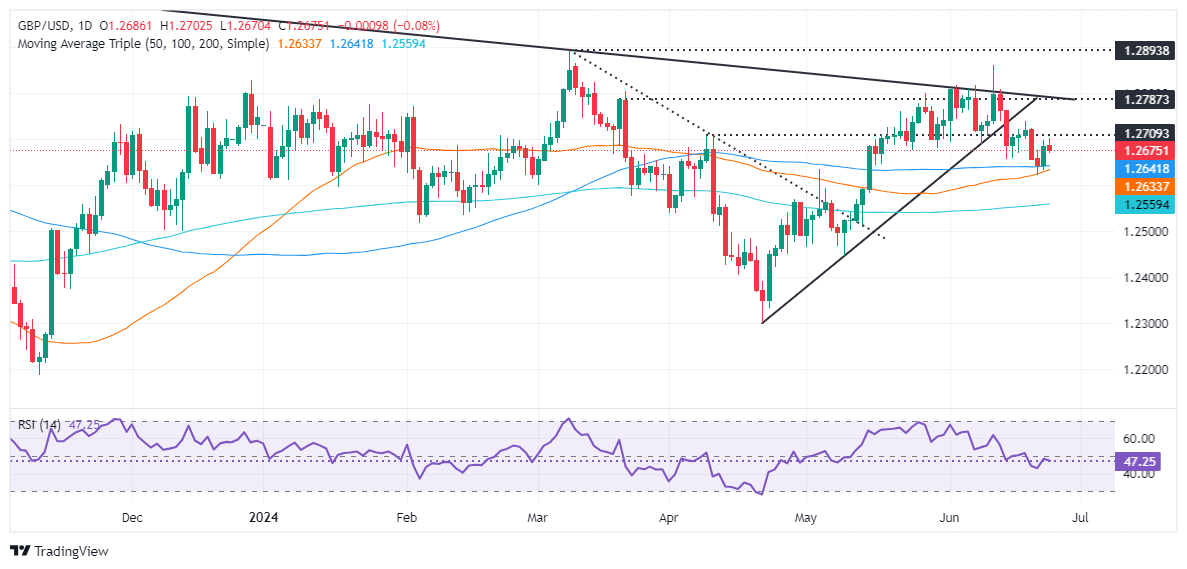
- Key support levels will be 100-DMA and the May 3 high at 1.2640/34, with further losses eyed beneath the psychological level of 1.2600.
- Key resistance levels are 1.2700 and previous support trendline turned resistance at 1.2730/40.
The Pound Sterling stayed firm against the Greenback on Tuesday, even though the latter remained positive, and a worse-than-expected Consumer Confidence report capped the US Dollar advance. Therefore, the GBP/USD trades at 1.2678, virtually unchanged.
GBP/USD Price Analysis: Technical outlook
The pair formed a ‘bullish piercing’ pattern, hinting that traders could challenge the next resistance seen at 1.2700, yet buyers remain reluctant to lift the GBP/USD towards that level.
Momentum still favors sellers, as depicted by the Relative Strength Index (RSI), which remains bearish and aims lower. That said, the GBP/USD path of least resistance is downwards.
The first support will be the confluence of the 100-day moving average (DMA) and the May 3 high-turned support at around 1.2640/34, closely followed by the 50-DMA at 1.2632. Once that area is surpassed, the psychological 1.2600 mark would be up next, ahead of the 200-DMA at 1.2555.
For a bullish continuation, traders must claim 1.2700 and clear a previous support trendline turned resistance at around 1.2730/40.
GBP/USD Price Action – Daily Chart


© 2000-2026. Bản quyền Teletrade.
Trang web này được quản lý bởi Teletrade D.J. LLC 2351 LLC 2022 (Euro House, Richmond Hill Road, Kingstown, VC0100, St. Vincent and the Grenadines).
Thông tin trên trang web không phải là cơ sở để đưa ra quyết định đầu tư và chỉ được cung cấp cho mục đích làm quen.
Giao dịch trên thị trường tài chính (đặc biệt là giao dịch sử dụng các công cụ biên) mở ra những cơ hội lớn và tạo điều kiện cho các nhà đầu tư sẵn sàng mạo hiểm để thu lợi nhuận, tuy nhiên nó mang trong mình nguy cơ rủi ro khá cao. Chính vì vậy trước khi tiến hành giao dịch cần phải xem xét mọi mặt vấn đề chấp nhận tiến hành giao dịch cụ thể xét theo quan điểm của nguồn lực tài chính sẵn có và mức độ am hiểu thị trường tài chính.
Sử dụng thông tin: sử dụng toàn bộ hay riêng biệt các dữ liệu trên trang web của công ty TeleTrade như một nguồn cung cấp thông tin nhất định. Việc sử dụng tư liệu từ trang web cần kèm theo liên kết đến trang teletrade.vn. Việc tự động thu thập số liệu cũng như thông tin từ trang web TeleTrade đều không được phép.
Xin vui lòng liên hệ với pr@teletrade.global nếu có câu hỏi.
ngân hàng