- Phân tích
- Tin tức và các công cụ
- Tin tức thị trường
- GBP/USD Price Analysis: Rises to 1.2700 nearing 14-day EMA
GBP/USD Price Analysis: Rises to 1.2700 nearing 14-day EMA
- GBP/USD extends gains to test 14-day EMA at 1.2704 level.
- A broadening bottom pattern on a daily chart suggests a potential correction before moving lower.
- The lower boundary of the broadening bottom pattern around the level of 1.2640 could act as a key support.
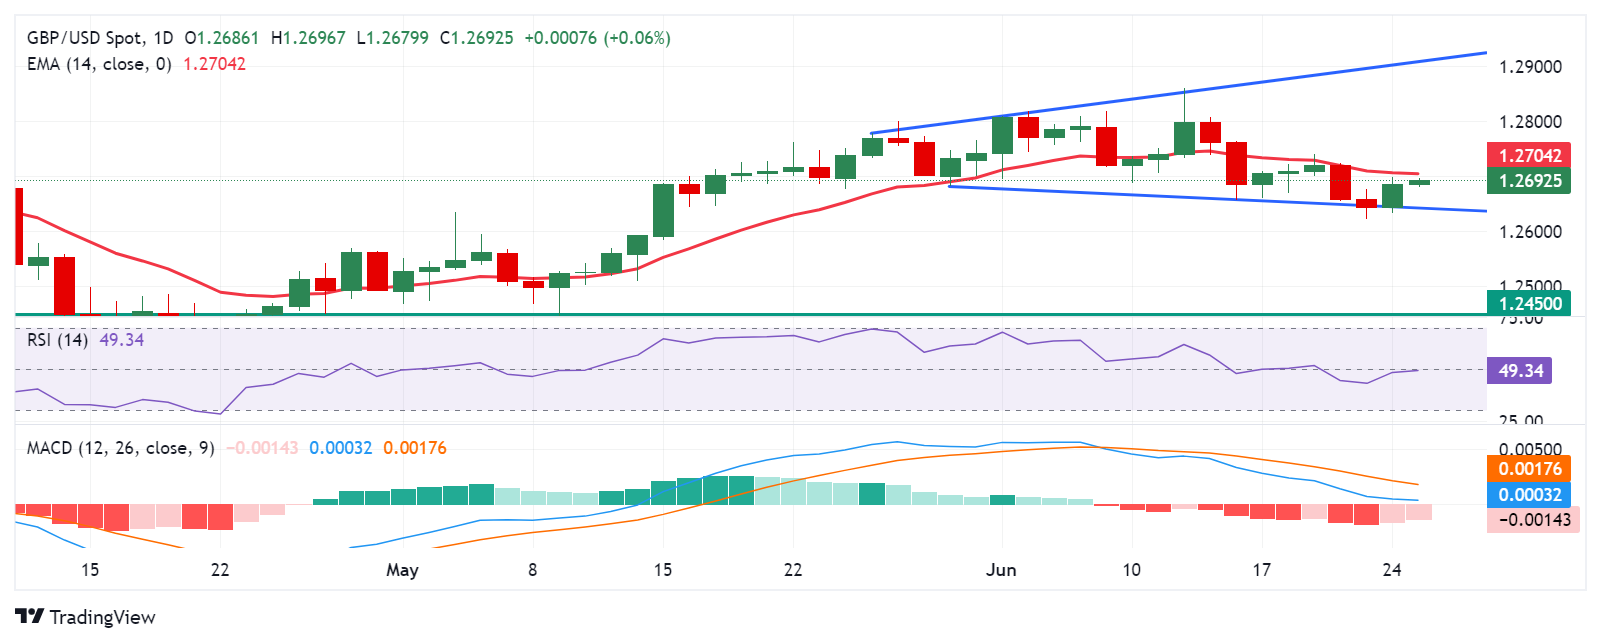
GBP/USD extends gains for the second successive session, trading around 1.2700 during Asian hours on Tuesday. Analysis of the daily chart shows a broadening bottom pattern in price action, representing increasing volatility. This chart pattern suggests a potential correction before moving lower.
The 14-day Relative Strength Index (RSI) is positioned below the 50 level, indicating a bearish bias. Furthermore, the Moving Average Convergence Divergence (MACD) momentum indicator also suggests a downward trend, as the MACD line is above the centerline but diverges below the signal line. Breaking below the centerline may strengthen the downward trend.
To the downside, the GBP/USD pair may find key support at the bottom wedge of the broadening bottom pattern around the level of 1.2640. A break below this level could exert pressure on the pair to navigate the vicinity of the throwback support at 1.2450.
In terms of resistance, the immediate barrier appears at the 14-day Exponential Moving Average (EMA) at the 1.2704 level. A breakthrough above this level could propel the GBP/USD pair toward testing the top wedge of the broadening bottom pattern around 1.2900.
GBP/USD: Daily Chart


© 2000-2026. Bản quyền Teletrade.
Trang web này được quản lý bởi Teletrade D.J. LLC 2351 LLC 2022 (Euro House, Richmond Hill Road, Kingstown, VC0100, St. Vincent and the Grenadines).
Thông tin trên trang web không phải là cơ sở để đưa ra quyết định đầu tư và chỉ được cung cấp cho mục đích làm quen.
Giao dịch trên thị trường tài chính (đặc biệt là giao dịch sử dụng các công cụ biên) mở ra những cơ hội lớn và tạo điều kiện cho các nhà đầu tư sẵn sàng mạo hiểm để thu lợi nhuận, tuy nhiên nó mang trong mình nguy cơ rủi ro khá cao. Chính vì vậy trước khi tiến hành giao dịch cần phải xem xét mọi mặt vấn đề chấp nhận tiến hành giao dịch cụ thể xét theo quan điểm của nguồn lực tài chính sẵn có và mức độ am hiểu thị trường tài chính.
Sử dụng thông tin: sử dụng toàn bộ hay riêng biệt các dữ liệu trên trang web của công ty TeleTrade như một nguồn cung cấp thông tin nhất định. Việc sử dụng tư liệu từ trang web cần kèm theo liên kết đến trang teletrade.vn. Việc tự động thu thập số liệu cũng như thông tin từ trang web TeleTrade đều không được phép.
Xin vui lòng liên hệ với pr@teletrade.global nếu có câu hỏi.
ngân hàng