- Phân tích
- Tin tức và các công cụ
- Tin tức thị trường
- NZD/JPY Price Analysis: Cross extends gains to multi-year highs around 97.50
NZD/JPY Price Analysis: Cross extends gains to multi-year highs around 97.50
- Buyers successfully clear previous losses, stabilizing the cross at 97.80
- The 20-day SMA at 96.60 remains an important support, defending against sellers' attempts.
- Approaching overbought conditions suggests a potential correction, although the overall outlook remains positive.
On Monday, the NZD/JPY pair recorded a low of 97.28 before buyers stepped in and cleared all losses, stabilizing the cross at around 97.80. The potent performance fortified the bullish sentiment, with the pair glowing at highs not seen since July 2007, but in entered the Asian session on a neutral note. In the last sessions, the 20-day Simple Moving Average (SMA) at 96.60 has emerged as strong support, with sellers yet unable to breach this level, serving to further solidify the positive outlook.
The daily Relative Strength Index (RSI) currently reads 67, indicating higher momentum than Friday's reading and continues to suggest an upward trend. Meanwhile, the Moving Average Convergence Divergence (MACD) for Monday presents a fresh green bar, indicating increased buying pressure. However, investors are advised caution as the RSI nears the overbought threshold, hinting at the possibility of a near-term correction.
NZD/JPY daily chart
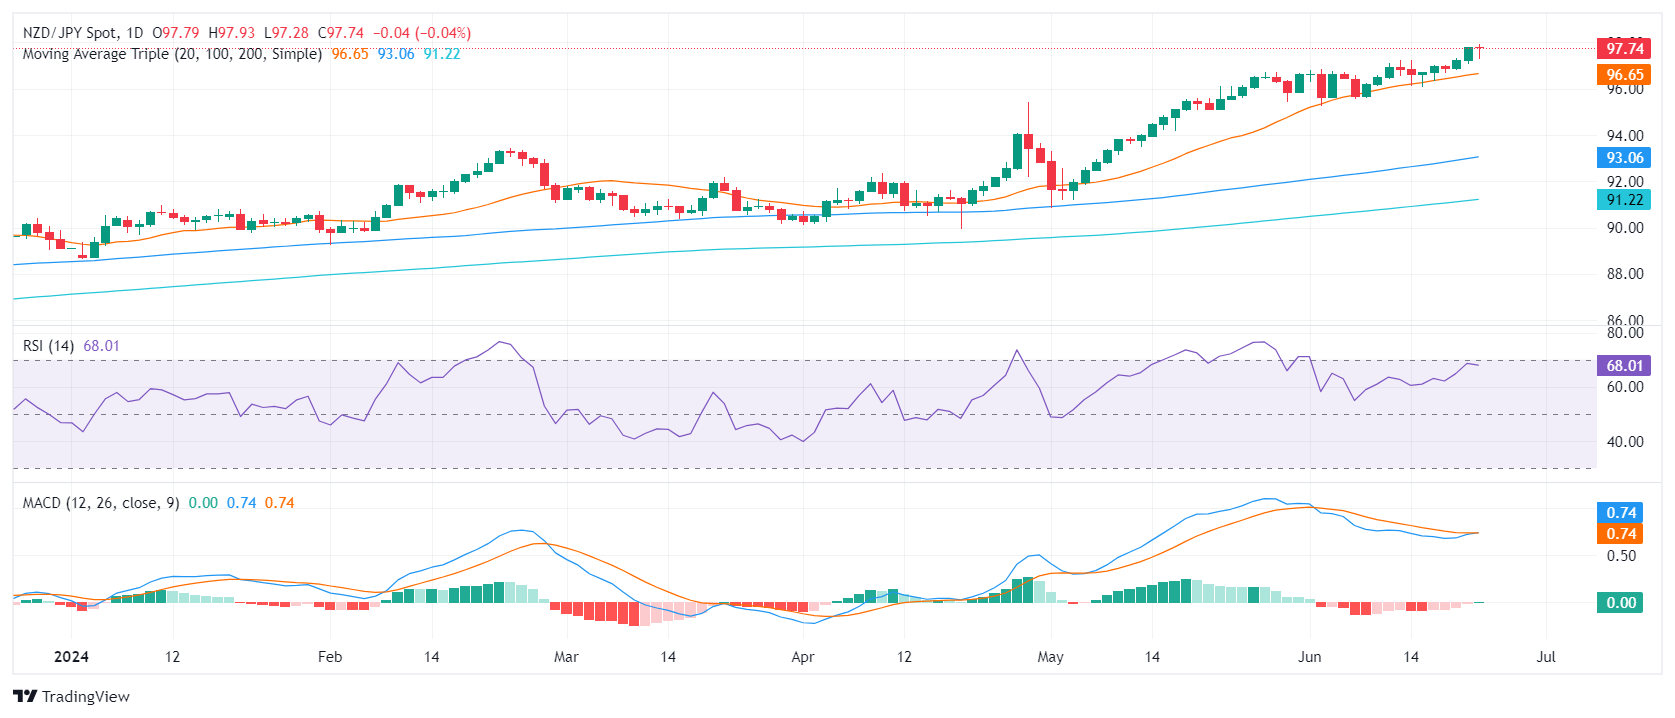
The bulls' resilience in maintaining positions above the 20-day SMA remains steadfast. This, combined with the approaching overbought daily technical indicators, further reinforces the positive technical outlook of the Kiwi against the Yen.
In subsequent trading sessions, the cross may fluctuate between the immediate support at 97.00 and the resistance target at 98.00. Investors should monitor these levels for a break above the consolidation range, indicating continued upward movement, or a breach below the 20-day SMA, which could signal a deeper correction. The 97.30 area also showed itself as a strong support.


© 2000-2026. Bản quyền Teletrade.
Trang web này được quản lý bởi Teletrade D.J. LLC 2351 LLC 2022 (Euro House, Richmond Hill Road, Kingstown, VC0100, St. Vincent and the Grenadines).
Thông tin trên trang web không phải là cơ sở để đưa ra quyết định đầu tư và chỉ được cung cấp cho mục đích làm quen.
Giao dịch trên thị trường tài chính (đặc biệt là giao dịch sử dụng các công cụ biên) mở ra những cơ hội lớn và tạo điều kiện cho các nhà đầu tư sẵn sàng mạo hiểm để thu lợi nhuận, tuy nhiên nó mang trong mình nguy cơ rủi ro khá cao. Chính vì vậy trước khi tiến hành giao dịch cần phải xem xét mọi mặt vấn đề chấp nhận tiến hành giao dịch cụ thể xét theo quan điểm của nguồn lực tài chính sẵn có và mức độ am hiểu thị trường tài chính.
Sử dụng thông tin: sử dụng toàn bộ hay riêng biệt các dữ liệu trên trang web của công ty TeleTrade như một nguồn cung cấp thông tin nhất định. Việc sử dụng tư liệu từ trang web cần kèm theo liên kết đến trang teletrade.vn. Việc tự động thu thập số liệu cũng như thông tin từ trang web TeleTrade đều không được phép.
Xin vui lòng liên hệ với pr@teletrade.global nếu có câu hỏi.
ngân hàng