- Phân tích
- Tin tức và các công cụ
- Tin tức thị trường
- EUR/JPY Price Analysis: Extends gains eye YTD high above 171.00
EUR/JPY Price Analysis: Extends gains eye YTD high above 171.00
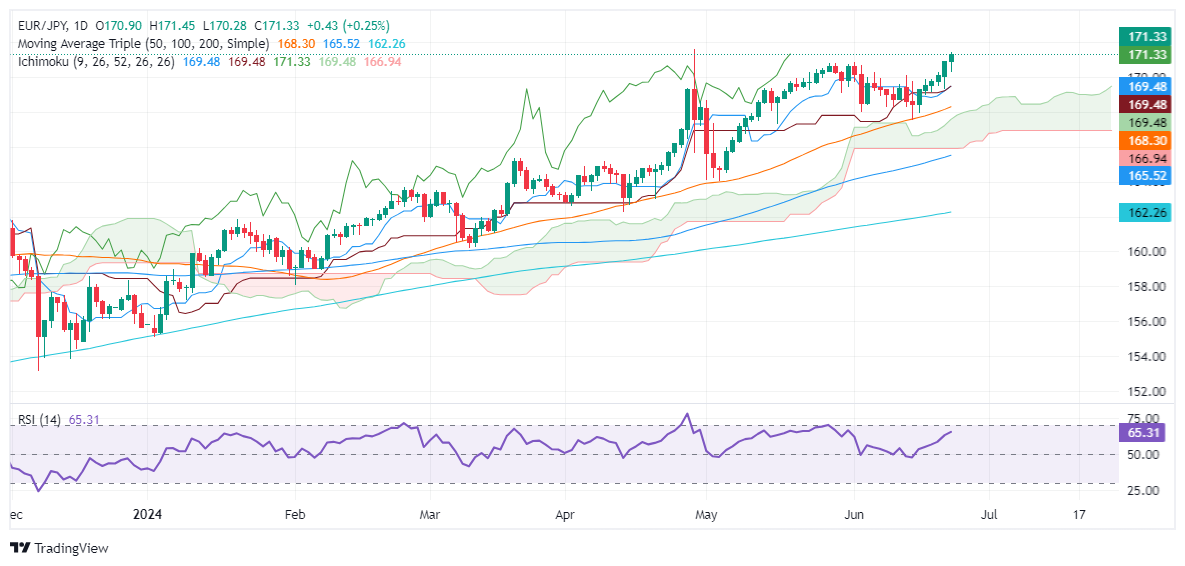
- EUR/JPY extends its gains for the sixth consecutive day and nearing the YTD high of 171.58.
- Technical outlook shows bullish momentum, with RSI indicating potential for further gains.
- Key resistance levels are YTD high at 171.58, 172.00, 172.50, and 173.00.
- Key support levels would be 171.00, the confluence of Tenkan, Kijun-Sen, and Senkou Span A at 169.48, and 50-DMA.
The EUR/JPY extended its gains for the sixth straight day on Monday and is up 0.24%. Yet it remains shy of testing the year-to-date (YTD) high reached on April 29 at 171.58. At the time of writing, the cross is trading at 171.29, above the 171.00 key technical level.
EUR/JPY Price Analysis: Technical outlook
The pair is set to extend its gains. Still, intervention fears that the Bank of Japan or the Minister of Finance might step into the FX markets loom, keeping investors on their toes.
Momentum suggests that the cross could extend its gains, as the Relative Strength Index (RSI) is bullish.
Therefore, the EUR/JPY first resistance would be the YTD high at 171.58. A breach of the latter will expose the 172.00 figure, followed by the 172.50 mark. Once those two levels are cleated, up next will be the 173.00 psychological level.
On further weakness, the EUR/JPY might be headed for a pullback, and test 171.00. Once cleared, the next support would be the confluence of the Tenkan, Kijun-Sen and Senkou Span A at 169.48. Once surpassed, the next stop would be the 50-day moving average (DMA) at 168.40.
EUR/JPY Price Action – Daily Chart


© 2000-2026. Bản quyền Teletrade.
Trang web này được quản lý bởi Teletrade D.J. LLC 2351 LLC 2022 (Euro House, Richmond Hill Road, Kingstown, VC0100, St. Vincent and the Grenadines).
Thông tin trên trang web không phải là cơ sở để đưa ra quyết định đầu tư và chỉ được cung cấp cho mục đích làm quen.
Giao dịch trên thị trường tài chính (đặc biệt là giao dịch sử dụng các công cụ biên) mở ra những cơ hội lớn và tạo điều kiện cho các nhà đầu tư sẵn sàng mạo hiểm để thu lợi nhuận, tuy nhiên nó mang trong mình nguy cơ rủi ro khá cao. Chính vì vậy trước khi tiến hành giao dịch cần phải xem xét mọi mặt vấn đề chấp nhận tiến hành giao dịch cụ thể xét theo quan điểm của nguồn lực tài chính sẵn có và mức độ am hiểu thị trường tài chính.
Sử dụng thông tin: sử dụng toàn bộ hay riêng biệt các dữ liệu trên trang web của công ty TeleTrade như một nguồn cung cấp thông tin nhất định. Việc sử dụng tư liệu từ trang web cần kèm theo liên kết đến trang teletrade.vn. Việc tự động thu thập số liệu cũng như thông tin từ trang web TeleTrade đều không được phép.
Xin vui lòng liên hệ với pr@teletrade.global nếu có câu hỏi.
ngân hàng