- Phân tích
- Tin tức và các công cụ
- Tin tức thị trường
- USD/JPY Price Analysis: Remains bullish amid intervention threats
USD/JPY Price Analysis: Remains bullish amid intervention threats
- USD/JPY advances towards 160.00 for the second time in 2024.
- Momentum favors buyers with a bullish RSI, but risks of downward pressure remain.
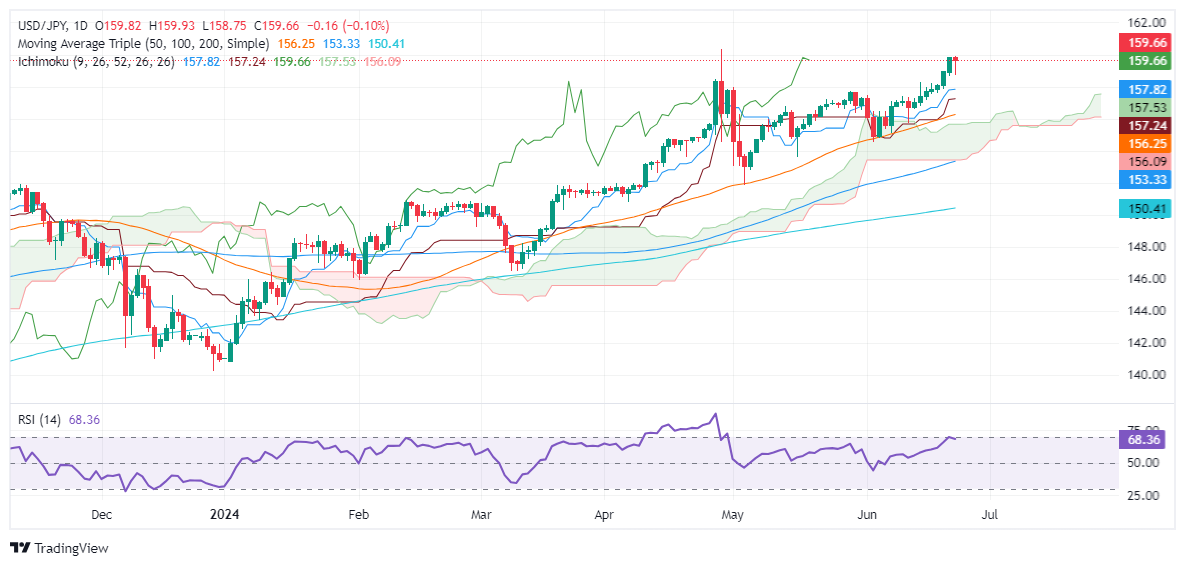
- Key resistance levels are 160.00, YTD high at 160.32, further gains at 160.50 and 161.00.
- Key support levels are the day's low at 158.75, Tenkan-Sen at 157.82, Senkou Span A at 157.53, and Kijun-Sen at 157.24.
The USD/JPY is flat but advanced steadily towards the 160.00 figure for the second time in 2024 and hit a two-month high of 159.93 before trimming some of earlier gains. The pair trades at 159.65, down some 0.10%, amid Japanese authority's verbal intervention.
USD/JPY Price Analysis: Technical outlook
The USD/JPY has managed to climb back above 159.00, even though traders were reluctant to re-test the Bank of Japan’s (BoJ) patience of intervening in the FX space to tame the Japanese Yen (JPY) depreciation.
Momentum favors buyers, with the Relatives Strength Index (RSI) remaining bullish, but downward risks remain. If the USD/JPY clears the psychological 160.00 mark, the next resistance would be the year-to-date (YTD) high of 160.32. Further gains are seen above 160.50 and at 161.00.
On the other hand, if USD/JPY drops below the day's low of 158.75, that could pave the way for testing key support levels. Up next would be the Tenkan-Sen at 157.82, followed by the Senkou Span A at 157.53, ahead of the Kijun-Sen at 157.24.
USD/JPY Price Action – Daily Chart


© 2000-2026. Bản quyền Teletrade.
Trang web này được quản lý bởi Teletrade D.J. LLC 2351 LLC 2022 (Euro House, Richmond Hill Road, Kingstown, VC0100, St. Vincent and the Grenadines).
Thông tin trên trang web không phải là cơ sở để đưa ra quyết định đầu tư và chỉ được cung cấp cho mục đích làm quen.
Giao dịch trên thị trường tài chính (đặc biệt là giao dịch sử dụng các công cụ biên) mở ra những cơ hội lớn và tạo điều kiện cho các nhà đầu tư sẵn sàng mạo hiểm để thu lợi nhuận, tuy nhiên nó mang trong mình nguy cơ rủi ro khá cao. Chính vì vậy trước khi tiến hành giao dịch cần phải xem xét mọi mặt vấn đề chấp nhận tiến hành giao dịch cụ thể xét theo quan điểm của nguồn lực tài chính sẵn có và mức độ am hiểu thị trường tài chính.
Sử dụng thông tin: sử dụng toàn bộ hay riêng biệt các dữ liệu trên trang web của công ty TeleTrade như một nguồn cung cấp thông tin nhất định. Việc sử dụng tư liệu từ trang web cần kèm theo liên kết đến trang teletrade.vn. Việc tự động thu thập số liệu cũng như thông tin từ trang web TeleTrade đều không được phép.
Xin vui lòng liên hệ với pr@teletrade.global nếu có câu hỏi.
ngân hàng