- Phân tích
- Tin tức và các công cụ
- Tin tức thị trường
- GBP/JPY Price Analysis: Bulls persist and propelled pair to fresh cycle, overbought signals arise
GBP/JPY Price Analysis: Bulls persist and propelled pair to fresh cycle, overbought signals arise
- GBP/JPY extends its rally, hitting fresh cycle highs of around 202.50 on Monday.
- Daily RSI and MACD stand near overbought territory.
- Trend remains bullish but overbought conditions suggest potential corrections.
During Monday's session, the GBP/JPY pair sustained its uptrend, hitting new cycle highs around 202.50, reaching its highest point since 2007. Despite sellers making strides earlier in the session, bringing the pair down to a low of 106.14, buyers managed to counteract and propel the pair back to fresh cycle highs.
The Daily Relative Strength Index (RSI) currently sits at 68, settling slightly below the overbought territory. The upsurge recorded in last Friday’s readings hints at remaining bullish momentum, though the swift approach to overbought conditions may suggest a potential incoming correction. The Daily Moving Average Convergence Divergence (MACD) continues to display rising green bars, implying that the bullish momentum is still in the play, albeit approaching a crest.
GBP/JPY daily chart
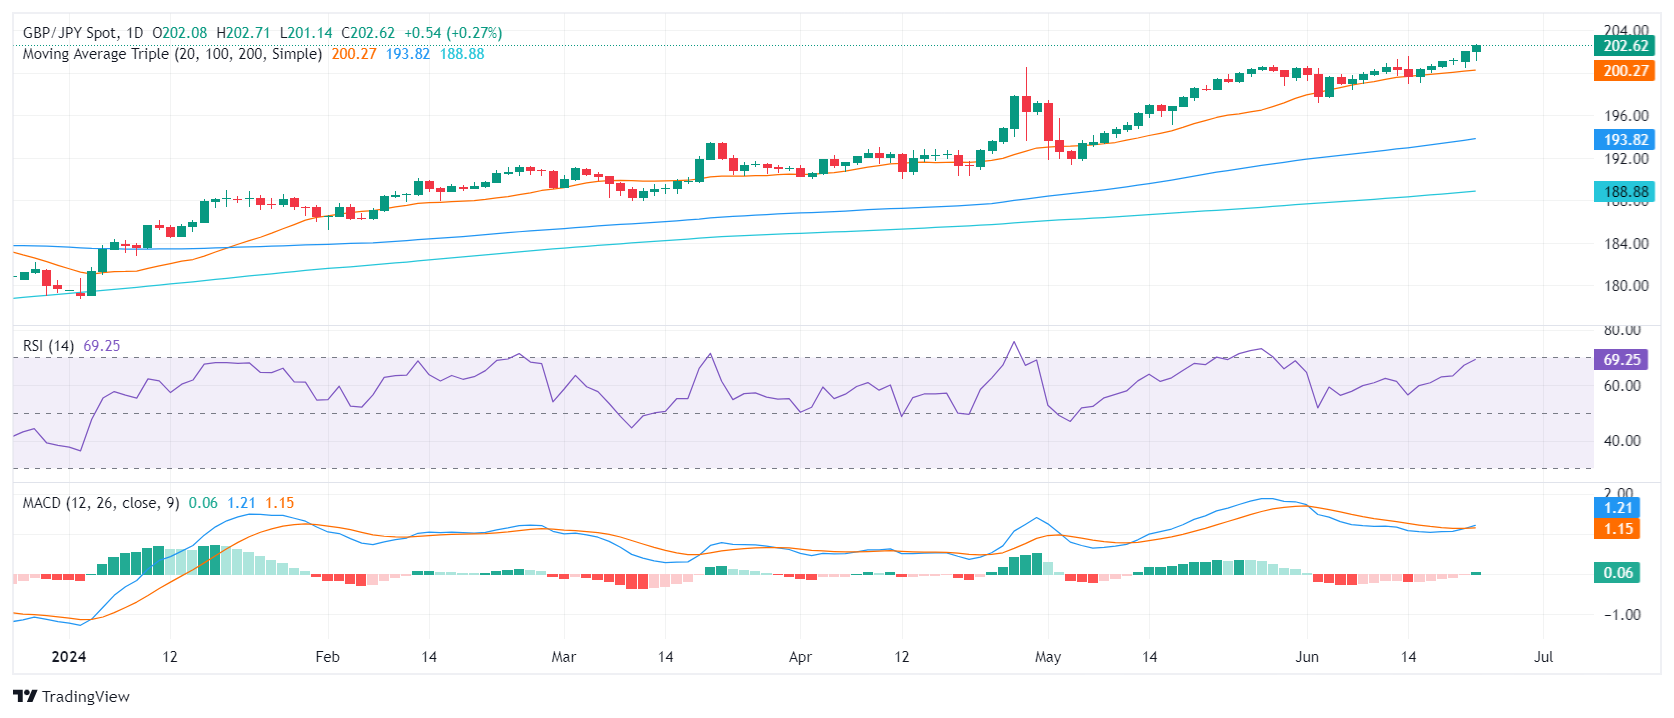
In summary, the GBP/JPY pair's solid performance on Monday underpins a broader bullish trend. The trend's positive outlook is validated by the pair's position above the 20-day, 100-day, and 200-day Simple Moving Averages (SMAs). However, as current indicators suggest over-extended movements, traders might brace for a likely correction event.
If the pair falls below the immediate support level set at 202.00, followed by the 201.00 and 202.20 levels (20-day SMA), it would likely seek new support thresholds at around the 200.00 psychological area. Conversely, resistance is seen near the psychological mark of 203.00 and further at 203.50, in case the bulls persist.


© 2000-2026. Bản quyền Teletrade.
Trang web này được quản lý bởi Teletrade D.J. LLC 2351 LLC 2022 (Euro House, Richmond Hill Road, Kingstown, VC0100, St. Vincent and the Grenadines).
Thông tin trên trang web không phải là cơ sở để đưa ra quyết định đầu tư và chỉ được cung cấp cho mục đích làm quen.
Giao dịch trên thị trường tài chính (đặc biệt là giao dịch sử dụng các công cụ biên) mở ra những cơ hội lớn và tạo điều kiện cho các nhà đầu tư sẵn sàng mạo hiểm để thu lợi nhuận, tuy nhiên nó mang trong mình nguy cơ rủi ro khá cao. Chính vì vậy trước khi tiến hành giao dịch cần phải xem xét mọi mặt vấn đề chấp nhận tiến hành giao dịch cụ thể xét theo quan điểm của nguồn lực tài chính sẵn có và mức độ am hiểu thị trường tài chính.
Sử dụng thông tin: sử dụng toàn bộ hay riêng biệt các dữ liệu trên trang web của công ty TeleTrade như một nguồn cung cấp thông tin nhất định. Việc sử dụng tư liệu từ trang web cần kèm theo liên kết đến trang teletrade.vn. Việc tự động thu thập số liệu cũng như thông tin từ trang web TeleTrade đều không được phép.
Xin vui lòng liên hệ với pr@teletrade.global nếu có câu hỏi.
ngân hàng