- Phân tích
- Tin tức và các công cụ
- Tin tức thị trường
- GBP/USD Price Analysis: Surges toward 1.2700 on US Dollar weakness
GBP/USD Price Analysis: Surges toward 1.2700 on US Dollar weakness
- GBP/USD up 0.40%, boosted as the US Dollar Index (DXY) hits a new two-day low.
- Technical outlook neutral to slightly bearish, with RSI signaling bearish momentum.
- Key support levels at 100-DMA (1.2664), 50-DMA (1.2627), 1.2600, and 200-DMA (1.2553).
- Resistance at 1.2700 and 1.2750, with less likelihood of being tested in the near term.
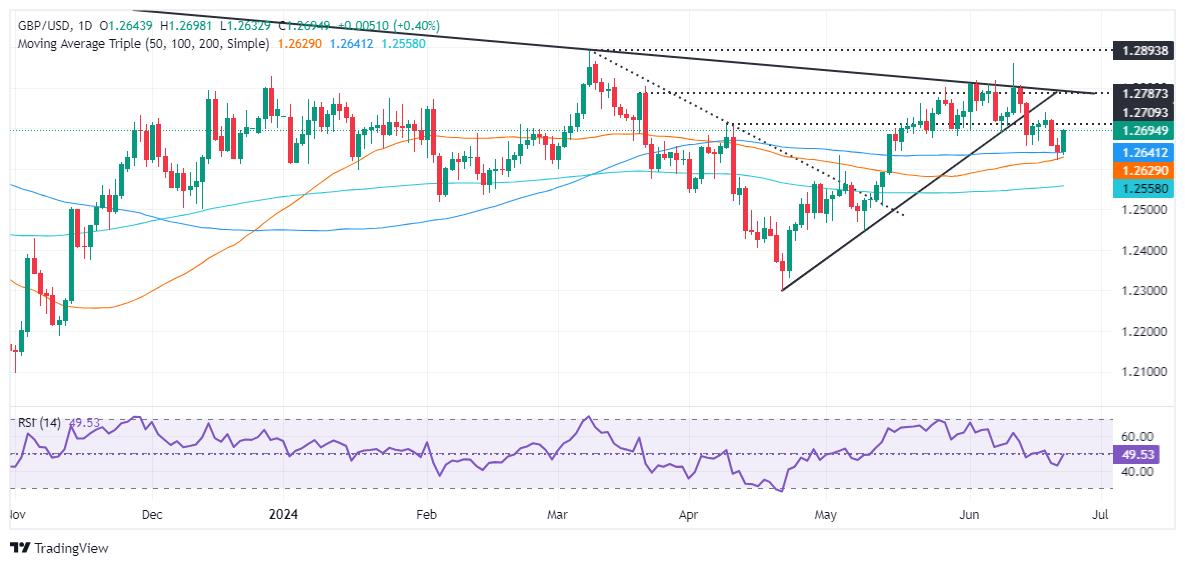
The Pound Sterling climbs sharply against the US Dollar as US Treasury bond yields remain unchanged, but the Greenback remains softer as it falls to a fresh two-day low, as depicted by the US Dollar Index (DXY). With the DXY dropping below 105.50, the GBP/USD rose and traded at 1.2691, up 0.40%.
GBP/USD Price Analysis: Technical outlook
From a daily chart perspective, the GBP/USD is neutral to slightly downward biased, even though the exchange rate trades above the daily moving averages (DMA).
The Relative Strength Index (RSI) turned bearish, hinting that sellers are in charge. It is eyeing a break of key support levels, which, once cleared, could cause the GBP/USD to re-test year-to-date (YTD) lows.
The first support would be the 100-DMA at 1.26643, ahead of the 50-DMA at 1.2627. A further downside lies beneath at 1.2600, exposing the 200-DMA at 1.2553 once surpassed. A breach of the latter, the pair will test 1.2500.
Conversely, and the less likely path in the near term, the GBP/USD first resistance level would be 1.2700. Once hurdle, the next stop would be 1.2750.
GBP/USD Price Action – Daily Chart


© 2000-2026. Bản quyền Teletrade.
Trang web này được quản lý bởi Teletrade D.J. LLC 2351 LLC 2022 (Euro House, Richmond Hill Road, Kingstown, VC0100, St. Vincent and the Grenadines).
Thông tin trên trang web không phải là cơ sở để đưa ra quyết định đầu tư và chỉ được cung cấp cho mục đích làm quen.
Giao dịch trên thị trường tài chính (đặc biệt là giao dịch sử dụng các công cụ biên) mở ra những cơ hội lớn và tạo điều kiện cho các nhà đầu tư sẵn sàng mạo hiểm để thu lợi nhuận, tuy nhiên nó mang trong mình nguy cơ rủi ro khá cao. Chính vì vậy trước khi tiến hành giao dịch cần phải xem xét mọi mặt vấn đề chấp nhận tiến hành giao dịch cụ thể xét theo quan điểm của nguồn lực tài chính sẵn có và mức độ am hiểu thị trường tài chính.
Sử dụng thông tin: sử dụng toàn bộ hay riêng biệt các dữ liệu trên trang web của công ty TeleTrade như một nguồn cung cấp thông tin nhất định. Việc sử dụng tư liệu từ trang web cần kèm theo liên kết đến trang teletrade.vn. Việc tự động thu thập số liệu cũng như thông tin từ trang web TeleTrade đều không được phép.
Xin vui lòng liên hệ với pr@teletrade.global nếu có câu hỏi.
ngân hàng