- Phân tích
- Tin tức và các công cụ
- Tin tức thị trường
- EUR/USD Price Analysis: Trims losses near 1.0700, the bearish outlook remains intact
EUR/USD Price Analysis: Trims losses near 1.0700, the bearish outlook remains intact
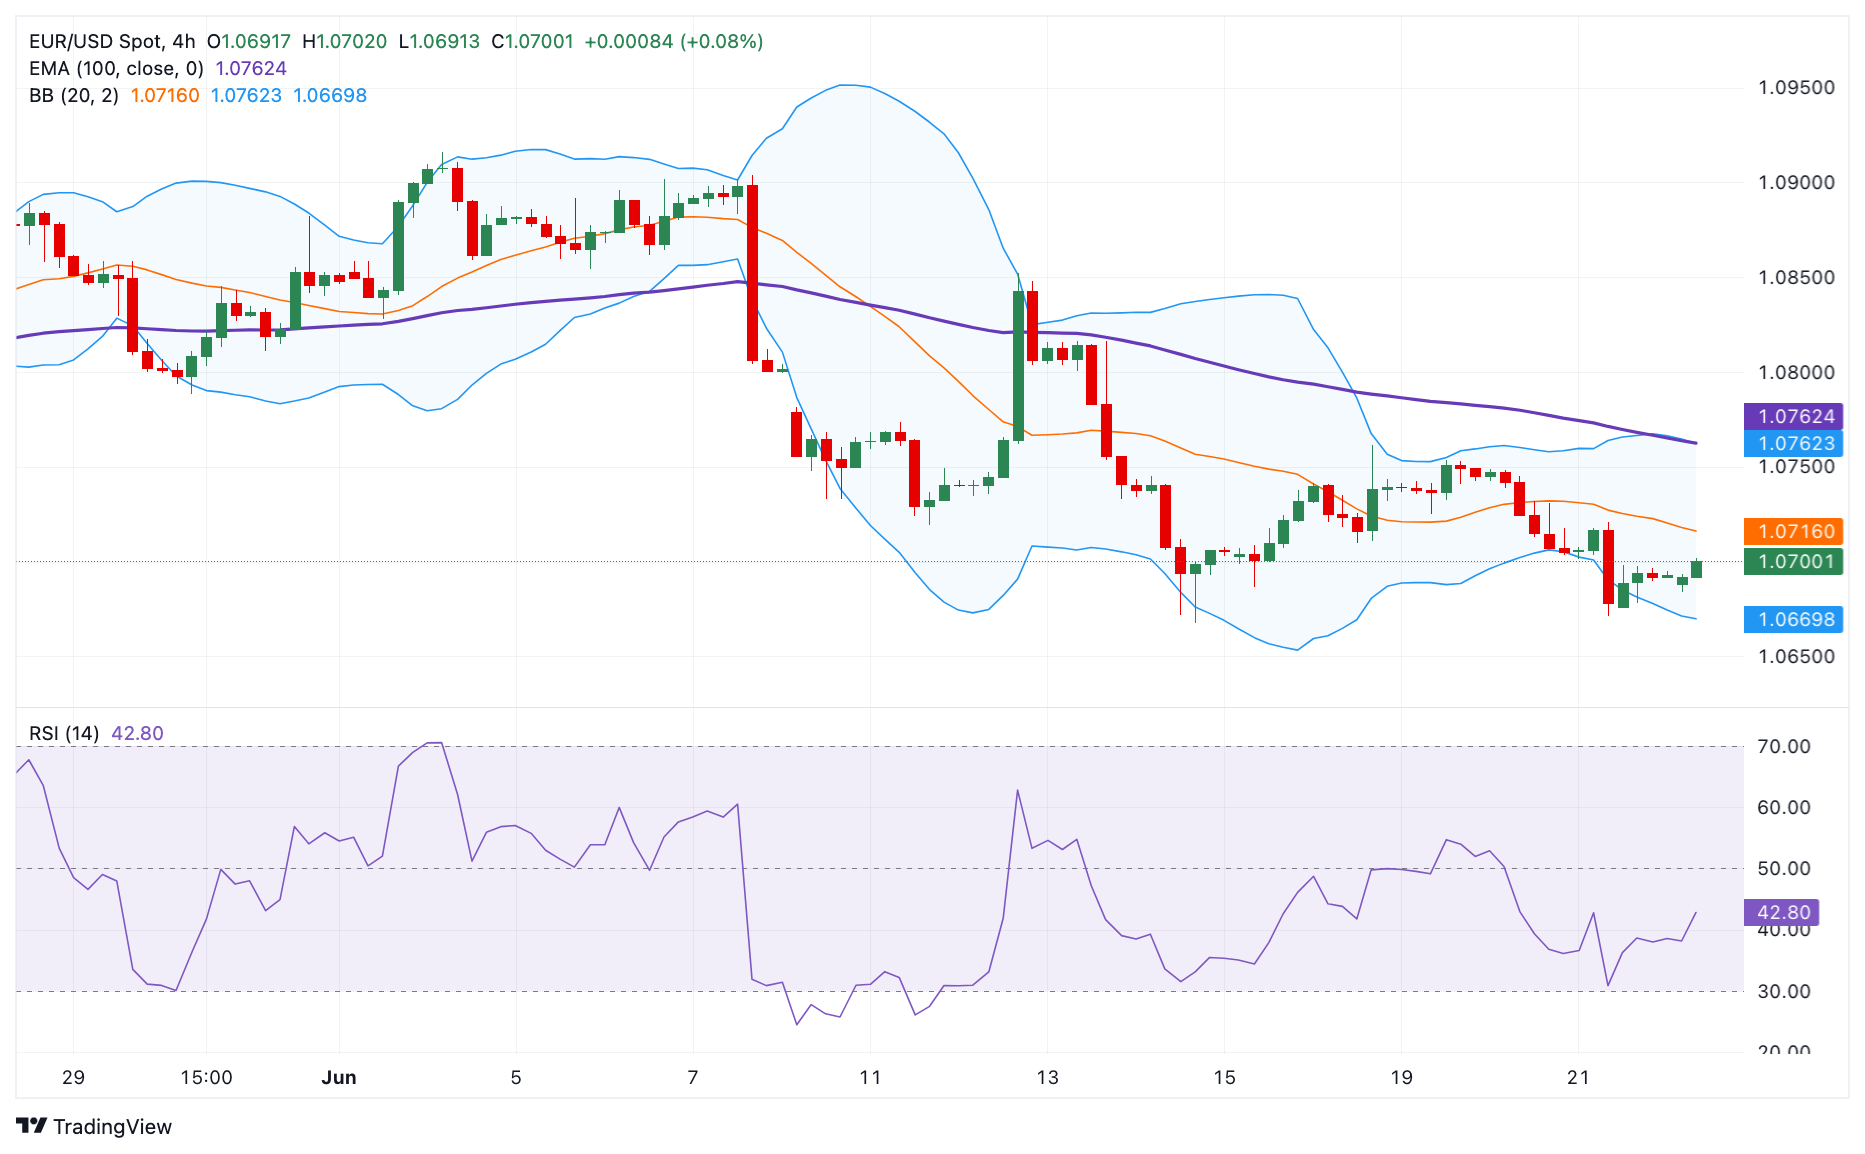
- EUR/USD trades on a stronger around 1.0700 in Monday’s early European session.
- The pair keeps the negative vibe below the key 100-period EMA, with the bearish RSI indicator.
- The key upside barrier will emerge near 1.0762; 1.0670 acts as an initial support level for the pair.
The EUR/USD pair trims losses near 1.0700 during the early European session on Monday. The upside of the major pair might be limited as investors are concerned about the political uncertainties in the Eurozone, particularly the outcome of a snap election in France. Furthermore, the firmer US Dollar (USD) after the stronger-than-expected US PMIs released on Friday might lift the Greenback and create a headwind for the pair.
Technically, the bearish outlook of EUR/USD remains intact as the major pair holds below the key 100-period Exponential Moving Average (EMA) on the 4-hour chart. The downward momentum is backed by the Relative Strength Index (RSI), which stands in the bearish zone near 40.0, indicating that further downside looks favorable.
The key upside barrier for EUR/USD will emerge near 1.0762, portraying the confluence of the 100-period EMA and the upper boundary of the Bollinger Band. Further north, the next hurdle is seen at 1.0815, a high of June 15. Any follow-through buying will see a rally to 1.0852, a high of June 12.
On the flip side, the lower limit of the Bollinger Band at 1.0670 acts as an initial support level for the major pair. A breach of this level will pave the way to 1.0650, a low of May 1. The additional downside filter to watch is the 1.0600 psychological level.
EUR/USD 4-hour chart


© 2000-2026. Bản quyền Teletrade.
Trang web này được quản lý bởi Teletrade D.J. LLC 2351 LLC 2022 (Euro House, Richmond Hill Road, Kingstown, VC0100, St. Vincent and the Grenadines).
Thông tin trên trang web không phải là cơ sở để đưa ra quyết định đầu tư và chỉ được cung cấp cho mục đích làm quen.
Giao dịch trên thị trường tài chính (đặc biệt là giao dịch sử dụng các công cụ biên) mở ra những cơ hội lớn và tạo điều kiện cho các nhà đầu tư sẵn sàng mạo hiểm để thu lợi nhuận, tuy nhiên nó mang trong mình nguy cơ rủi ro khá cao. Chính vì vậy trước khi tiến hành giao dịch cần phải xem xét mọi mặt vấn đề chấp nhận tiến hành giao dịch cụ thể xét theo quan điểm của nguồn lực tài chính sẵn có và mức độ am hiểu thị trường tài chính.
Sử dụng thông tin: sử dụng toàn bộ hay riêng biệt các dữ liệu trên trang web của công ty TeleTrade như một nguồn cung cấp thông tin nhất định. Việc sử dụng tư liệu từ trang web cần kèm theo liên kết đến trang teletrade.vn. Việc tự động thu thập số liệu cũng như thông tin từ trang web TeleTrade đều không được phép.
Xin vui lòng liên hệ với pr@teletrade.global nếu có câu hỏi.
ngân hàng