- Phân tích
- Tin tức và các công cụ
- Tin tức thị trường
- NZD/JPY Price Analysis: Cross extends gains to multi-year highs past 97.50
NZD/JPY Price Analysis: Cross extends gains to multi-year highs past 97.50
- The cross continued its upward journey, reaching new cycle highs above 97.50, levels not seen since July 2007.
- The daily chart shows intense bullish sentiment, with the Yen weakening against its peers.
- Indicators are approaching overbought conditions which might limit the upside.
On Friday, the NZD/JPY cross extended advances and established multi-year highs above 97.50. The 20-day Simple Moving Average (SMA), now at 96.60 continued as firm support at the beginning of the week, where buyers ward off sellers' strivings to breach this level.
The daily Relative Strength Index (RSI) for NZD/JPY is currently at 68, indicating an increase from Thursday's value and overall upward momentum. Meanwhile, the Moving Average Convergence Divergence (MACD) for today shows decreasing red bars, implying decreased selling pressure. The RSI near 70 should flash caution to investors as it approaches the overbought threshold.
NZD/JPY daily chart
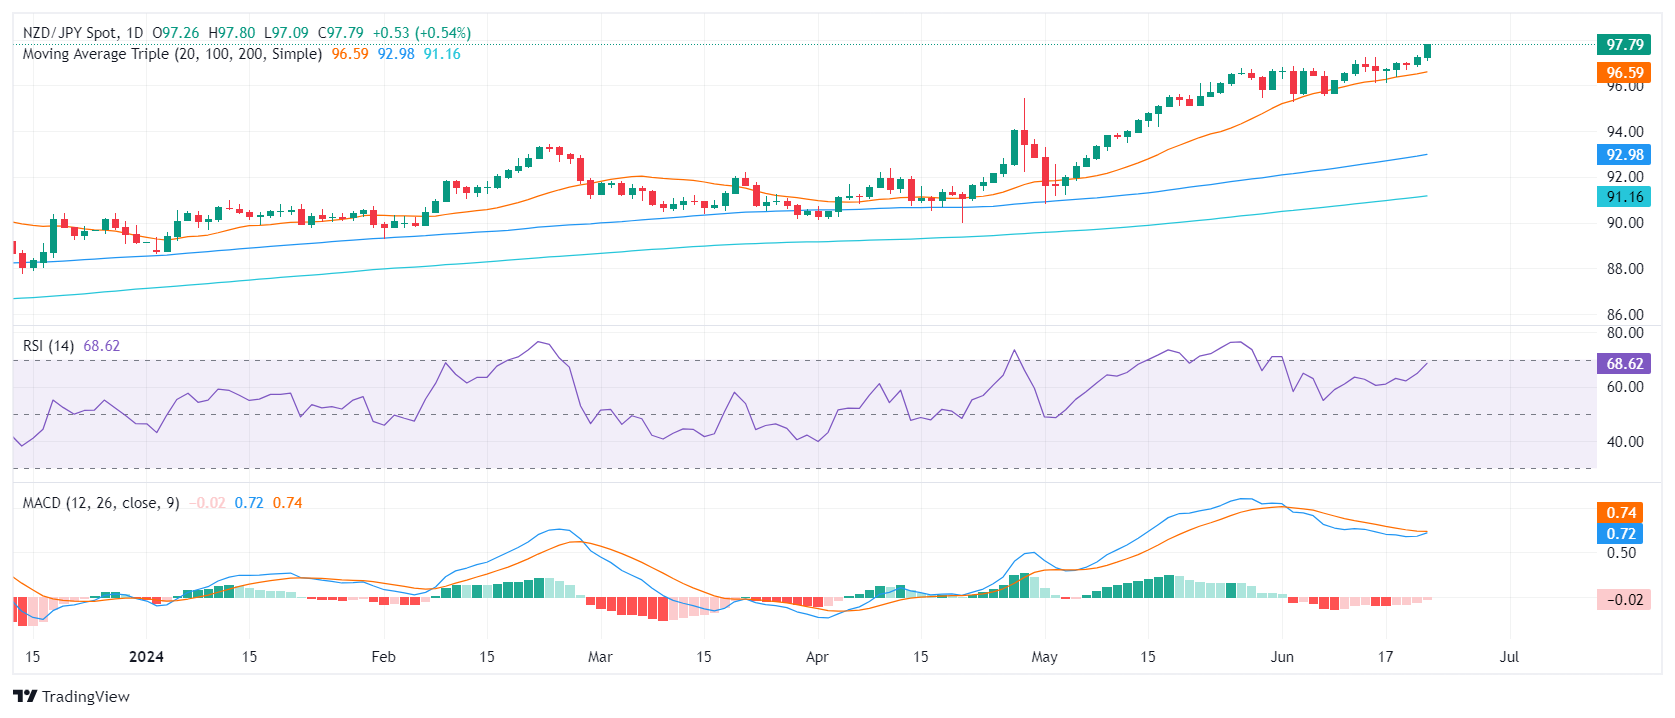
The bulls' tenacity to sustain their positions above the 20-day SMA remains unshaken. This, combined with the near-overbought daily technical indicators, reinforces the superior technical vim of the Kiwi against the Yen. The consecutive failed attempts from the sellers to breach the 96.30 point, a strong support, led to the bulls' momentum which catalyzed the surge to fresh highs.
For the following trading sessions, the cross may oscillate between the immediate support at 97.00 and the resistance target at 98.00. Investors need to keep an eye on a possible break above the mentioned range or a fall below the 20-day SMA mark which could signal a deeper correction.


© 2000-2026. Bản quyền Teletrade.
Trang web này được quản lý bởi Teletrade D.J. LLC 2351 LLC 2022 (Euro House, Richmond Hill Road, Kingstown, VC0100, St. Vincent and the Grenadines).
Thông tin trên trang web không phải là cơ sở để đưa ra quyết định đầu tư và chỉ được cung cấp cho mục đích làm quen.
Giao dịch trên thị trường tài chính (đặc biệt là giao dịch sử dụng các công cụ biên) mở ra những cơ hội lớn và tạo điều kiện cho các nhà đầu tư sẵn sàng mạo hiểm để thu lợi nhuận, tuy nhiên nó mang trong mình nguy cơ rủi ro khá cao. Chính vì vậy trước khi tiến hành giao dịch cần phải xem xét mọi mặt vấn đề chấp nhận tiến hành giao dịch cụ thể xét theo quan điểm của nguồn lực tài chính sẵn có và mức độ am hiểu thị trường tài chính.
Sử dụng thông tin: sử dụng toàn bộ hay riêng biệt các dữ liệu trên trang web của công ty TeleTrade như một nguồn cung cấp thông tin nhất định. Việc sử dụng tư liệu từ trang web cần kèm theo liên kết đến trang teletrade.vn. Việc tự động thu thập số liệu cũng như thông tin từ trang web TeleTrade đều không được phép.
Xin vui lòng liên hệ với pr@teletrade.global nếu có câu hỏi.
ngân hàng