- Phân tích
- Tin tức và các công cụ
- Tin tức thị trường
- NZD/JPY Price Analysis: Cross extends gains, establishes fresh highs above 97.00
NZD/JPY Price Analysis: Cross extends gains, establishes fresh highs above 97.00
- The cross resumed its gains, establishing new cycle highs at levels exceeding 97.00.
- The daily chart continues to display resilience, increasing chances for the upward trend to persist.
On Thursday, the NZD/JPY cross made further gains, moving past the previous resistance at 97.00 and setting a fresh cycle high. At the start of the week, support around the 20-day Simple Moving Average (SMA) at 96.30 held strong as buyers swiftly stepped in to overpower the sellers' efforts to breach this level.
The daily Relative Strength Index (RSI) for NZD/JPY currently stands at 62, denoting a climb from Wednesday's reading and overall positive momentum. Meanwhile, the Moving Average Convergence Divergence (MACD) for today prints decreasing red bars, signifying a reduction in selling pressure.
NZD/JPY daily chart
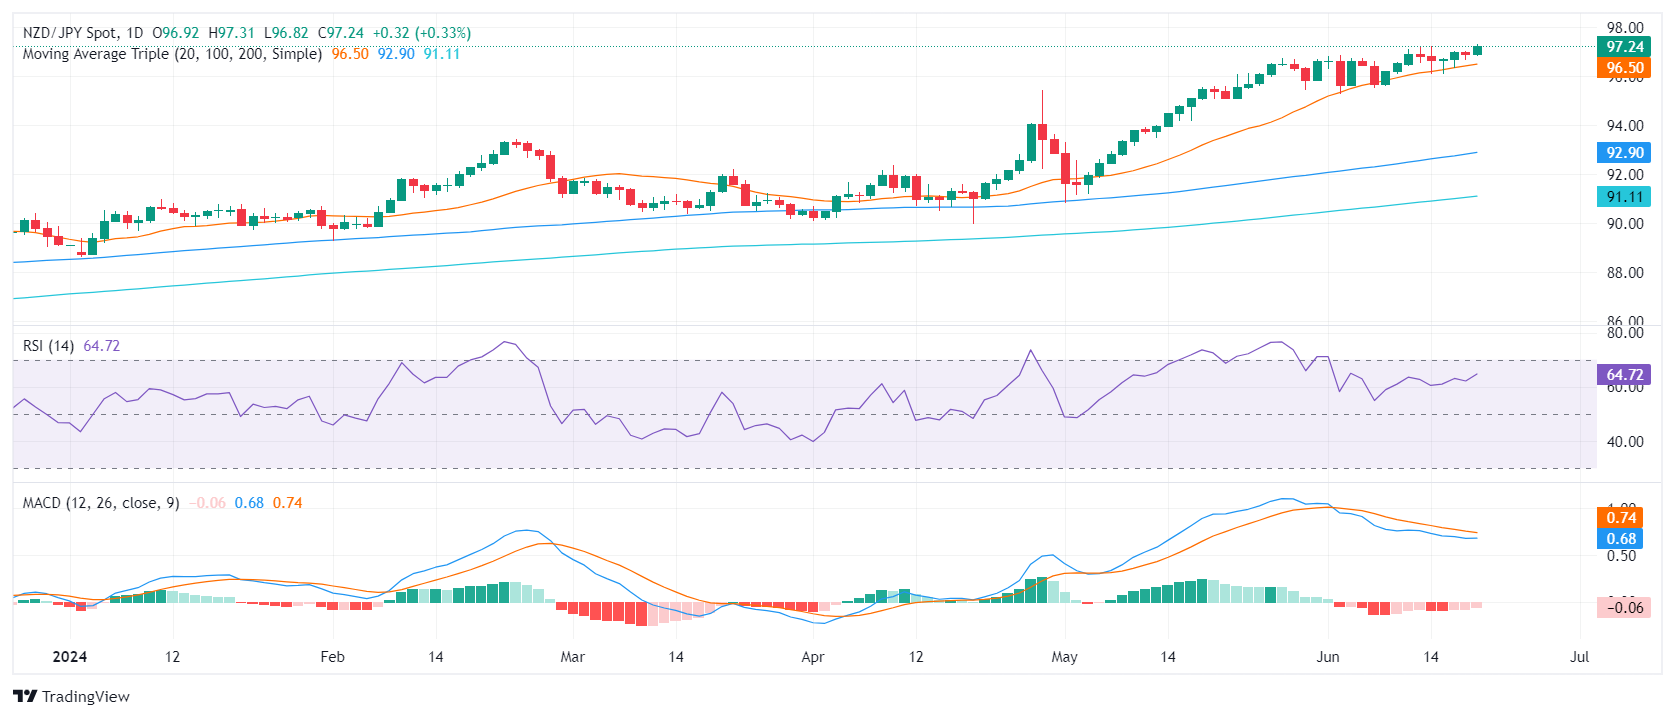
The bull's resolve to keep its position above the 20-day SMA remains steadfast. This, coupled with the resilience of the daily technical indicators, highlights a clear technical strength of the Kiwi over the Yen. The three consecutive failed attempts from the sellers to breach the 96.30 mark fuelled the buyers' momentum, which paved the way for the climb to fresh highs.
Going forward, the trading sessions may witness the cross oscillate between the immediate support at 97.00 and the resistance target of 98.00. Close monitoring of the breach above the current consolidation range or a dip below the 20-SMA mark could potentially provide insights into future movements.


© 2000-2026. Bản quyền Teletrade.
Trang web này được quản lý bởi Teletrade D.J. LLC 2351 LLC 2022 (Euro House, Richmond Hill Road, Kingstown, VC0100, St. Vincent and the Grenadines).
Thông tin trên trang web không phải là cơ sở để đưa ra quyết định đầu tư và chỉ được cung cấp cho mục đích làm quen.
Giao dịch trên thị trường tài chính (đặc biệt là giao dịch sử dụng các công cụ biên) mở ra những cơ hội lớn và tạo điều kiện cho các nhà đầu tư sẵn sàng mạo hiểm để thu lợi nhuận, tuy nhiên nó mang trong mình nguy cơ rủi ro khá cao. Chính vì vậy trước khi tiến hành giao dịch cần phải xem xét mọi mặt vấn đề chấp nhận tiến hành giao dịch cụ thể xét theo quan điểm của nguồn lực tài chính sẵn có và mức độ am hiểu thị trường tài chính.
Sử dụng thông tin: sử dụng toàn bộ hay riêng biệt các dữ liệu trên trang web của công ty TeleTrade như một nguồn cung cấp thông tin nhất định. Việc sử dụng tư liệu từ trang web cần kèm theo liên kết đến trang teletrade.vn. Việc tự động thu thập số liệu cũng như thông tin từ trang web TeleTrade đều không được phép.
Xin vui lòng liên hệ với pr@teletrade.global nếu có câu hỏi.
ngân hàng