- Phân tích
- Tin tức và các công cụ
- Tin tức thị trường
- NZD/USD Price Analysis: Bears grow stronger, as the pair struggles under the 20-day SMA
NZD/USD Price Analysis: Bears grow stronger, as the pair struggles under the 20-day SMA
- Despite NZD/USD's attempts to recover losses, another rejection at the 20-day SMA sees a retreat to 0.6122.
- The short-term outlook is increasingly bearish, with rising selling traction visible.
- For a break in the bearish outlook, the pair must recover the 20-day SMA at 0.6150.
On Thursday, the NZD/USD extended its losses below the 20-day Simple Moving Average (SMA), its fourth consecutive rejection at this strong support level this week. The pair retreated to 0.6122. Despite attempts to recover losses, indicators are signalling rising bearish traction potentially paving the way for further downside unless the pair can regain control over the 20-day SMA around the 0.6150 mark.
The Relative Strength Index (RSI) of the NZDUSD daily chart positions at 49, slightly below the neutral territory. Compared to Tuesday's reading of 51, the RSI indicators are pointing south, suggesting a potential decrease in the market momentum. Despite near-term downward dynamics, it remains distanced from the oversold conditions. The Moving Average Convergence Divergence (MACD) profile continues to print rising red bars indicating an elevated presence of sellers in the market.
NZD/USD daily chart
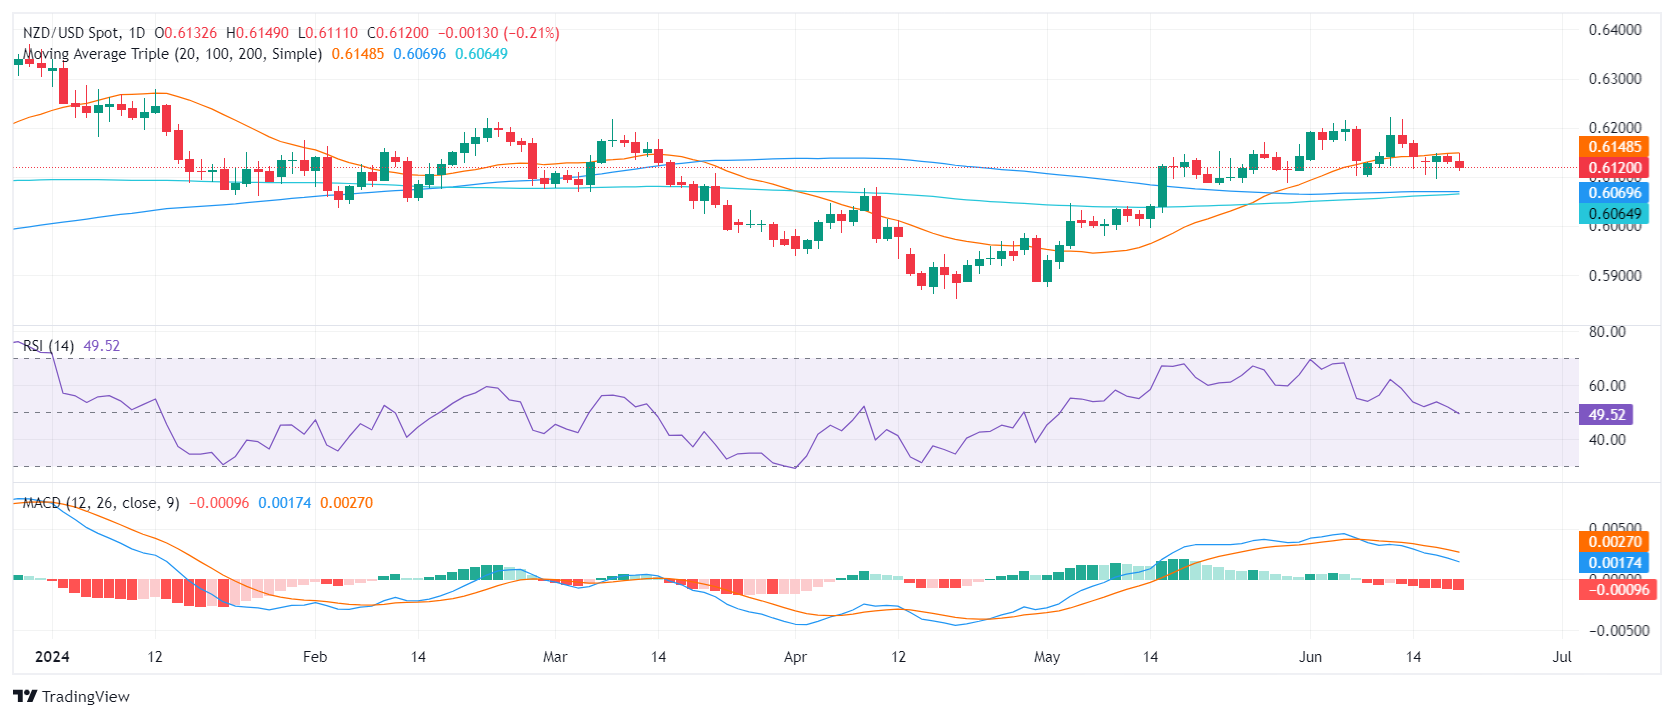
For the NZD/USD, immediate support remains near the 0.6100 level. Further support is available at the convergence of the 100-day and 200-day SMAs at 0.60695 and 0.60627 respectively. These levels could provide a solid foundation in the event of an extension of the downside move. A break below these SMA convergence points might be indicative of a strong sell-off scenario.
In stark contrast, resistance for the pair is entrenched around the 20-day SMA at 0.6150 level. Then higher up at 0.6170 and finally at the 0.6200 level. A decisive breakout above these levels could potentially signify the end of the current bearish market sentiment and a shift toward bullish dynamics.


© 2000-2026. Bản quyền Teletrade.
Trang web này được quản lý bởi Teletrade D.J. LLC 2351 LLC 2022 (Euro House, Richmond Hill Road, Kingstown, VC0100, St. Vincent and the Grenadines).
Thông tin trên trang web không phải là cơ sở để đưa ra quyết định đầu tư và chỉ được cung cấp cho mục đích làm quen.
Giao dịch trên thị trường tài chính (đặc biệt là giao dịch sử dụng các công cụ biên) mở ra những cơ hội lớn và tạo điều kiện cho các nhà đầu tư sẵn sàng mạo hiểm để thu lợi nhuận, tuy nhiên nó mang trong mình nguy cơ rủi ro khá cao. Chính vì vậy trước khi tiến hành giao dịch cần phải xem xét mọi mặt vấn đề chấp nhận tiến hành giao dịch cụ thể xét theo quan điểm của nguồn lực tài chính sẵn có và mức độ am hiểu thị trường tài chính.
Sử dụng thông tin: sử dụng toàn bộ hay riêng biệt các dữ liệu trên trang web của công ty TeleTrade như một nguồn cung cấp thông tin nhất định. Việc sử dụng tư liệu từ trang web cần kèm theo liên kết đến trang teletrade.vn. Việc tự động thu thập số liệu cũng như thông tin từ trang web TeleTrade đều không được phép.
Xin vui lòng liên hệ với pr@teletrade.global nếu có câu hỏi.
ngân hàng