- Phân tích
- Tin tức và các công cụ
- Tin tức thị trường
- AUD/JPY Price Analysis: Strong bullish momentum pushes pair to fresh cycle highs
AUD/JPY Price Analysis: Strong bullish momentum pushes pair to fresh cycle highs
- AUD/JPY continues its rally, reaching fresh cycle highs around 105.70 on Thursday.
- Daily RSI and MACD stand deep in positive terrain.
- Indicators point towards more room for additional gains.
During Thursday's session, the AUD/JPY pair maintained its uptrend, achieving new cycle highs around 105.70, its the highest point reached since 2013. There has been a clear consolidation around the 104.00 level in the last sessions, and as the sellers failed to make a significant move, buyers stepped in.
On a daily scale, the Relative Strength Index (RSI) of the AUDJPY has risen to 68, up from 63 recorded on Wednesday. This increase suggests bullish momentum continues to gain strength. The Moving Average Convergence Divergence (MACD) marker persists in showing rising green bars, indicating the bullish momentum is far from plateauing.
AUD/JPY daily chart
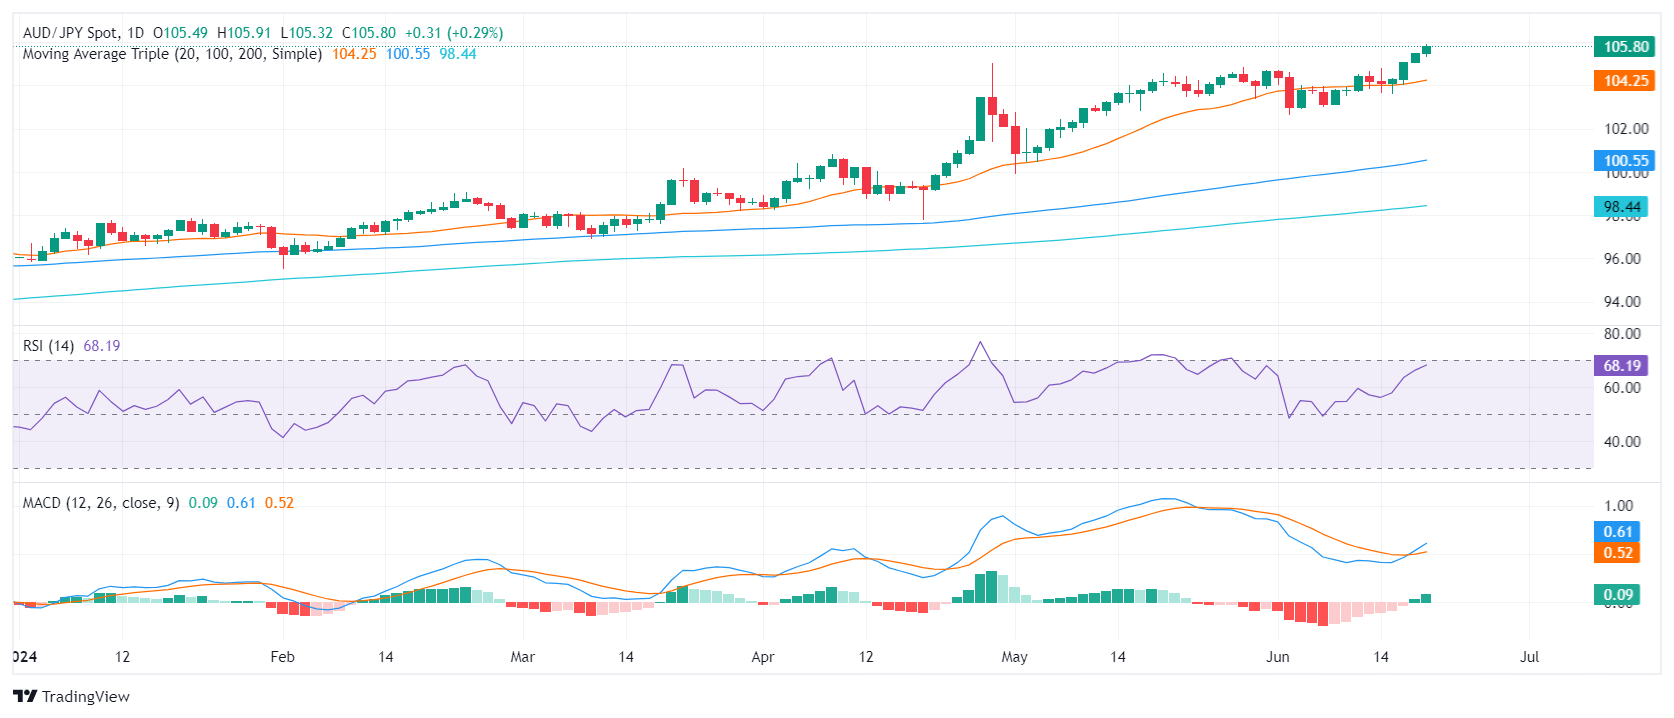 In summary, the AUD/JPY pair's robust showing on Thursday endorses a broader bullish outlook, with the intensity of the trend validated by the pair's position above the 20-day, 100-day, and 200-day Simple Moving Averages (SMAs). Looking forward, traders can expect the pair to sustain its uptrend, potentially reaching into the 105.80-106.00 range, as current indicators do not suggest over-extended movements and hence provide space for subsequent gains.
On the off chance that the pair falls below the support level set at 105.00, followed by the 104.15 level (20-day SMA), it would likely seek new support thresholds. As such, the 102.50 and 100.35 levels may serve as potential support lines.


© 2000-2026. Bản quyền Teletrade.
Trang web này được quản lý bởi Teletrade D.J. LLC 2351 LLC 2022 (Euro House, Richmond Hill Road, Kingstown, VC0100, St. Vincent and the Grenadines).
Thông tin trên trang web không phải là cơ sở để đưa ra quyết định đầu tư và chỉ được cung cấp cho mục đích làm quen.
Giao dịch trên thị trường tài chính (đặc biệt là giao dịch sử dụng các công cụ biên) mở ra những cơ hội lớn và tạo điều kiện cho các nhà đầu tư sẵn sàng mạo hiểm để thu lợi nhuận, tuy nhiên nó mang trong mình nguy cơ rủi ro khá cao. Chính vì vậy trước khi tiến hành giao dịch cần phải xem xét mọi mặt vấn đề chấp nhận tiến hành giao dịch cụ thể xét theo quan điểm của nguồn lực tài chính sẵn có và mức độ am hiểu thị trường tài chính.
Sử dụng thông tin: sử dụng toàn bộ hay riêng biệt các dữ liệu trên trang web của công ty TeleTrade như một nguồn cung cấp thông tin nhất định. Việc sử dụng tư liệu từ trang web cần kèm theo liên kết đến trang teletrade.vn. Việc tự động thu thập số liệu cũng như thông tin từ trang web TeleTrade đều không được phép.
Xin vui lòng liên hệ với pr@teletrade.global nếu có câu hỏi.
ngân hàng