- Phân tích
- Tin tức và các công cụ
- Tin tức thị trường
- USD/JPY Price Analysis: Steadies as Asian session begins, above 158.00
USD/JPY Price Analysis: Steadies as Asian session begins, above 158.00
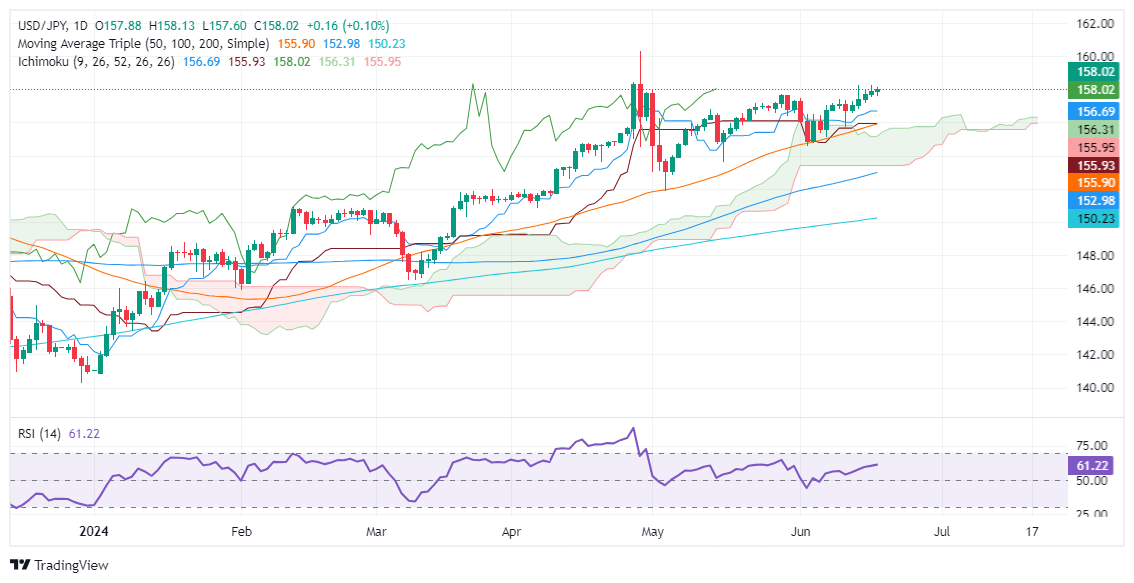
- USD/JPY remains above Ichimoku Cloud, Tenkan, and Kijun-Sen levels, supporting further upside potential.
- Key resistance levels: 158.25 (June 17 high), 158.44 (April 26 peak), and 160.32 (YTD high).
- Support levels: 157.00, Tenkan-Sen at 156.98, Senkou Span A at 156.16, and Kijun-Sen at 155.93.
The USD/JPY remains flat as Thursday’s Asian session begins, yet it printed minuscule gains of 0.15% on Wednesday. The lack of catalysts and US traders away from their desks in observance of the Juneteenth holiday dried up the FX space, which has remained unmoved since the London close. The major trades at 158.00, virtually unchanged
USD/JPY Price Analysis: Technical outlook
The pair’s uptrend remains intact, with the spot price remaining above the Ichimoku Cloud (Kumo) and on top of the Tenkan and Kijun-Sen levels. Those reasons justify further USD/JPY upside, but fears that Japanese authorities might intervene in the markets keep traders cautious, with the major advancing steadily.
The Relative Strength Index (RSI) remains bullish, supporting buyers.
The first key resistance level they need to clear is the June 17 high of 158.25. Once surpassed, the next stop would be the April 26 peak at 158.44 ahead of the year-to-date (YTD) high of 160.32 would be next.
Conversely, sellers can challenge key support levels if USD/JPY drops below 157.00. The first would be the Tenkan-Sen at 156.98, followed by Senkou Span A at 156.16. Once cleared, the next stop would be the Kijun-Sen at 155.93. The next demand area would be the Senkou Span B at 155.52.
USD/JPY Price Action – Daily Chart


© 2000-2026. Bản quyền Teletrade.
Trang web này được quản lý bởi Teletrade D.J. LLC 2351 LLC 2022 (Euro House, Richmond Hill Road, Kingstown, VC0100, St. Vincent and the Grenadines).
Thông tin trên trang web không phải là cơ sở để đưa ra quyết định đầu tư và chỉ được cung cấp cho mục đích làm quen.
Giao dịch trên thị trường tài chính (đặc biệt là giao dịch sử dụng các công cụ biên) mở ra những cơ hội lớn và tạo điều kiện cho các nhà đầu tư sẵn sàng mạo hiểm để thu lợi nhuận, tuy nhiên nó mang trong mình nguy cơ rủi ro khá cao. Chính vì vậy trước khi tiến hành giao dịch cần phải xem xét mọi mặt vấn đề chấp nhận tiến hành giao dịch cụ thể xét theo quan điểm của nguồn lực tài chính sẵn có và mức độ am hiểu thị trường tài chính.
Sử dụng thông tin: sử dụng toàn bộ hay riêng biệt các dữ liệu trên trang web của công ty TeleTrade như một nguồn cung cấp thông tin nhất định. Việc sử dụng tư liệu từ trang web cần kèm theo liên kết đến trang teletrade.vn. Việc tự động thu thập số liệu cũng như thông tin từ trang web TeleTrade đều không được phép.
Xin vui lòng liên hệ với pr@teletrade.global nếu có câu hỏi.
ngân hàng