- Phân tích
- Tin tức và các công cụ
- Tin tức thị trường
- GBP/USD Price Analysis: Climbs back above 1.2700 on US holiday
GBP/USD Price Analysis: Climbs back above 1.2700 on US holiday
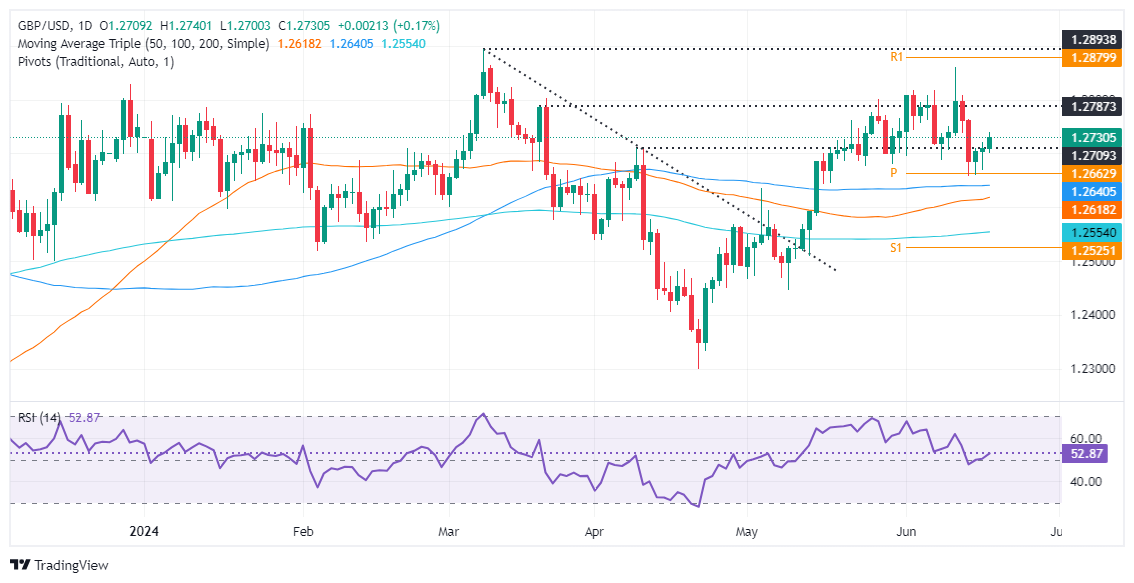
- GBP/USD tests key-support trendline turned resistance at around 1.2730.
- Technical outlook shows momentum favoring buyers, but unable to sustain gains above 1.2800.
- Key resistance at 1.2739 and 1.2800, with support levels at 1.2700, 1.2643, and 1.2617.
The Pound Sterling modestly gains versus the Greenback on Wednesday, amid thin liquidity conditions, due to US traders being in observance of Juneteenth. Therefore, with US markets being closed, the GBP/USD could remain subdued, and trade at 1.2729 at the time of writing.
GBP/USD Price Analysis: Technical outlook
After hitting a three-month high at 1.2860, the GBP/SD dropped more than 100 pips and cleared a support trendline drawn from lows of May 17 that passes at around 1.2730.
Although momentum favors buyers with the Relative Strength Index (RSI) above the 50-neutral line, the major has failed to sustain the uptrend above 1.2800.
Risk events, like the latest inflation report, could not lift the GBP/USD close to 1.2800. That, along with Thursday’s Bank of England decision, will keep the pair trading volatile in the upcoming days.
Key resistance levels lie at 1.2739, the current week’s high, followed by 1.2800. Once cleared, the next stop would be the monthly high of 1.2860.
Conversely, if GBP/USD stumbles past 1.2700, that will expose the confluence of technical indicators, like the May 3 high turned support and the 50-day moving average (DMA) at 1.2643/39, ahead of the 50-DMA at 1.2617. Further losses lie once cleared, like the 1.2600 figure and the 200-DMA at 1.2550.
GBP/USD Price Action – Daily Chart


© 2000-2026. Bản quyền Teletrade.
Trang web này được quản lý bởi Teletrade D.J. LLC 2351 LLC 2022 (Euro House, Richmond Hill Road, Kingstown, VC0100, St. Vincent and the Grenadines).
Thông tin trên trang web không phải là cơ sở để đưa ra quyết định đầu tư và chỉ được cung cấp cho mục đích làm quen.
Giao dịch trên thị trường tài chính (đặc biệt là giao dịch sử dụng các công cụ biên) mở ra những cơ hội lớn và tạo điều kiện cho các nhà đầu tư sẵn sàng mạo hiểm để thu lợi nhuận, tuy nhiên nó mang trong mình nguy cơ rủi ro khá cao. Chính vì vậy trước khi tiến hành giao dịch cần phải xem xét mọi mặt vấn đề chấp nhận tiến hành giao dịch cụ thể xét theo quan điểm của nguồn lực tài chính sẵn có và mức độ am hiểu thị trường tài chính.
Sử dụng thông tin: sử dụng toàn bộ hay riêng biệt các dữ liệu trên trang web của công ty TeleTrade như một nguồn cung cấp thông tin nhất định. Việc sử dụng tư liệu từ trang web cần kèm theo liên kết đến trang teletrade.vn. Việc tự động thu thập số liệu cũng như thông tin từ trang web TeleTrade đều không được phép.
Xin vui lòng liên hệ với pr@teletrade.global nếu có câu hỏi.
ngân hàng