- Phân tích
- Tin tức và các công cụ
- Tin tức thị trường
- NZD/JPY Price Analysis: Kiwi gains ground and test the 97.00 level
NZD/JPY Price Analysis: Kiwi gains ground and test the 97.00 level
- The Kiwi sees gains against the Yen, approaching the 97.00 resistance point.
- Daily chart indicators reflect strength, hinting at potential up-move continuation.
- Resistance looms at 97.00- 98.00; however, strong buying traction could drive a breakout to the upside.
In Tuesday's session, the NZD/JPY pair saw promising upticks, edging closer to the 97.00 resistance point after a strong defense of the 20-day Simple Moving Average (SMA) at 96.30, which has proven to be resilient against sellers' attempts.
The daily Relative Strength Index (RSI) for NZD/JPY now registers 63, indicating a positive shift and an increase in buying momentum. On the other hand, the Moving Average Convergence Divergence (MACD) continues to print decreasing red bars, suggesting the ongoing consolidation phase may ease for an upward climb.
NZD/JPY daily chart
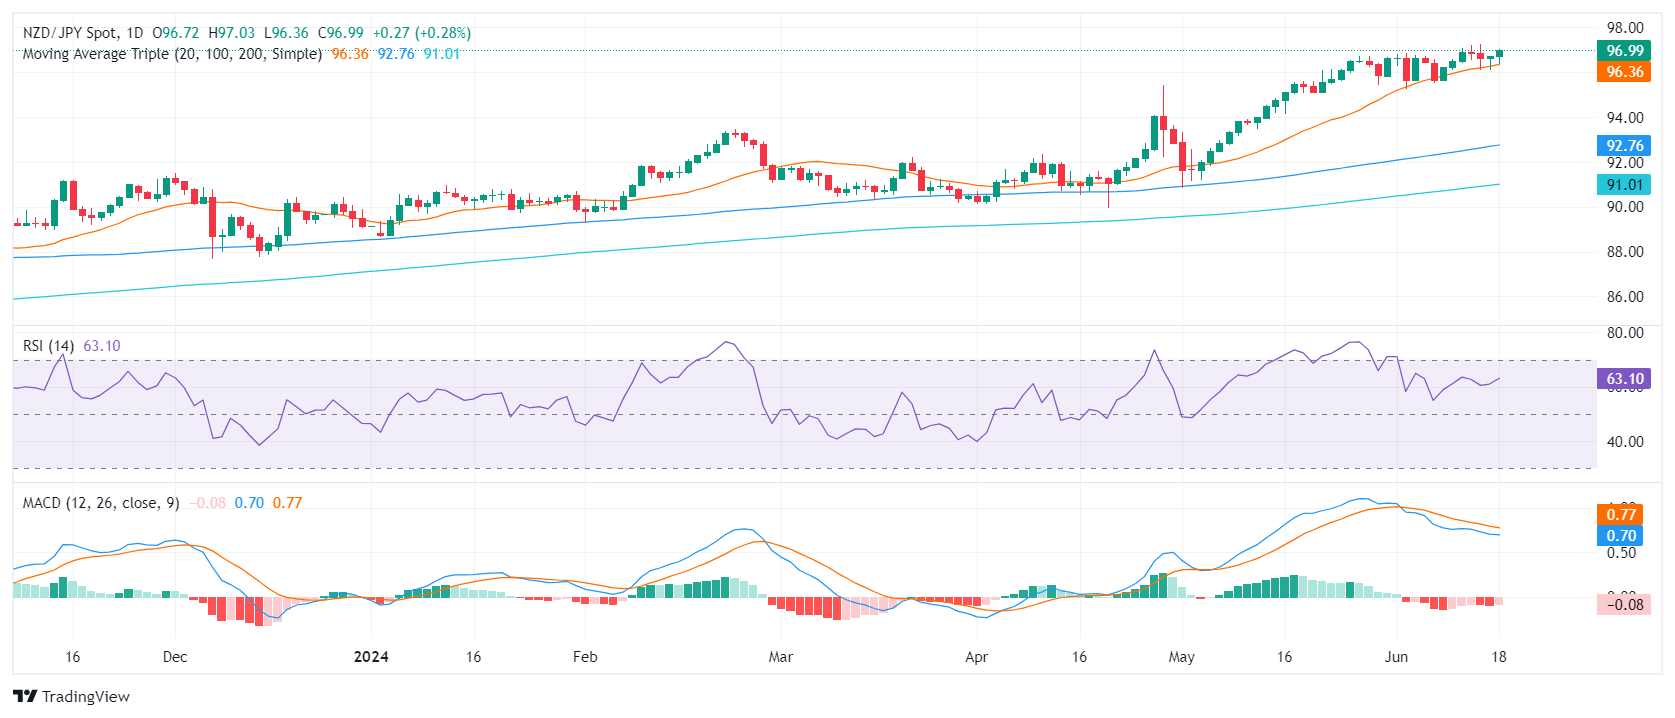
In a determined effort, buyers continue to hold their positions above the 20-day Simple Moving Average (SMA) in a bid to solidify the bullish trend's longevity. The recent upward shifts noted in the daily technical indicators highlight an intention among market participants to bring the consolidation phase to an end. In the last sessions, the pair side-ways traded using the 20-day SMA as a support and buyers seem to be back on track after a brief breather.
Incoming trading sessions might see the pair navigating the territory between support levels at 96.30 (20-day SMA) and 95.00, and resistance level at 97.00, aiming for the recent high near 97.30. Notably, the resilience of buyers defending the 20-day SMA at 96.30 is a promising sign for a potential upward continuation. Below those levels, the long-term 100 and 200-day Simple Moving Averages (SMAs) at approximately 92.00 - 91.00, respectively, continue providing overall support for the bullish narrative.


© 2000-2026. Bản quyền Teletrade.
Trang web này được quản lý bởi Teletrade D.J. LLC 2351 LLC 2022 (Euro House, Richmond Hill Road, Kingstown, VC0100, St. Vincent and the Grenadines).
Thông tin trên trang web không phải là cơ sở để đưa ra quyết định đầu tư và chỉ được cung cấp cho mục đích làm quen.
Giao dịch trên thị trường tài chính (đặc biệt là giao dịch sử dụng các công cụ biên) mở ra những cơ hội lớn và tạo điều kiện cho các nhà đầu tư sẵn sàng mạo hiểm để thu lợi nhuận, tuy nhiên nó mang trong mình nguy cơ rủi ro khá cao. Chính vì vậy trước khi tiến hành giao dịch cần phải xem xét mọi mặt vấn đề chấp nhận tiến hành giao dịch cụ thể xét theo quan điểm của nguồn lực tài chính sẵn có và mức độ am hiểu thị trường tài chính.
Sử dụng thông tin: sử dụng toàn bộ hay riêng biệt các dữ liệu trên trang web của công ty TeleTrade như một nguồn cung cấp thông tin nhất định. Việc sử dụng tư liệu từ trang web cần kèm theo liên kết đến trang teletrade.vn. Việc tự động thu thập số liệu cũng như thông tin từ trang web TeleTrade đều không được phép.
Xin vui lòng liên hệ với pr@teletrade.global nếu có câu hỏi.
ngân hàng