- Phân tích
- Tin tức và các công cụ
- Tin tức thị trường
- NZD/USD Price Analysis: Bears lose some claws as the pair manages to recoup losses
NZD/USD Price Analysis: Bears lose some claws as the pair manages to recoup losses
- Despite declining below the 20-day SMA, the NZD/USD recovers some losses to stabilize at 0.6140.
- Short-term outlook remains bearish, but seller momentum isn’t that strong..
- Bulls must recover the 20-day SMA at 0.61450.
On Tuesday, the NZD/USD extended its decline, initially dropping to 0.6095, but managed to pare the majority of its losses by the end of the trading day. Buyers staged a comeback, pushing the pair back towards 0.6140. However, the short-term outlook still leans towards the downside, but the day's recovery is a positive sign for the pair.
According to the daily chart, the Relative Strength Index (RSI) at 53 suggests a neutral situation. This implies that the market is neither overbought nor oversold, providing some room for upward movement if the buying pressures can keep the momentum. However, the Moving Average Convergence Divergence (MACD) continues to print red bars, which confirms the presence of the sellers.
NZD/USD daily chart
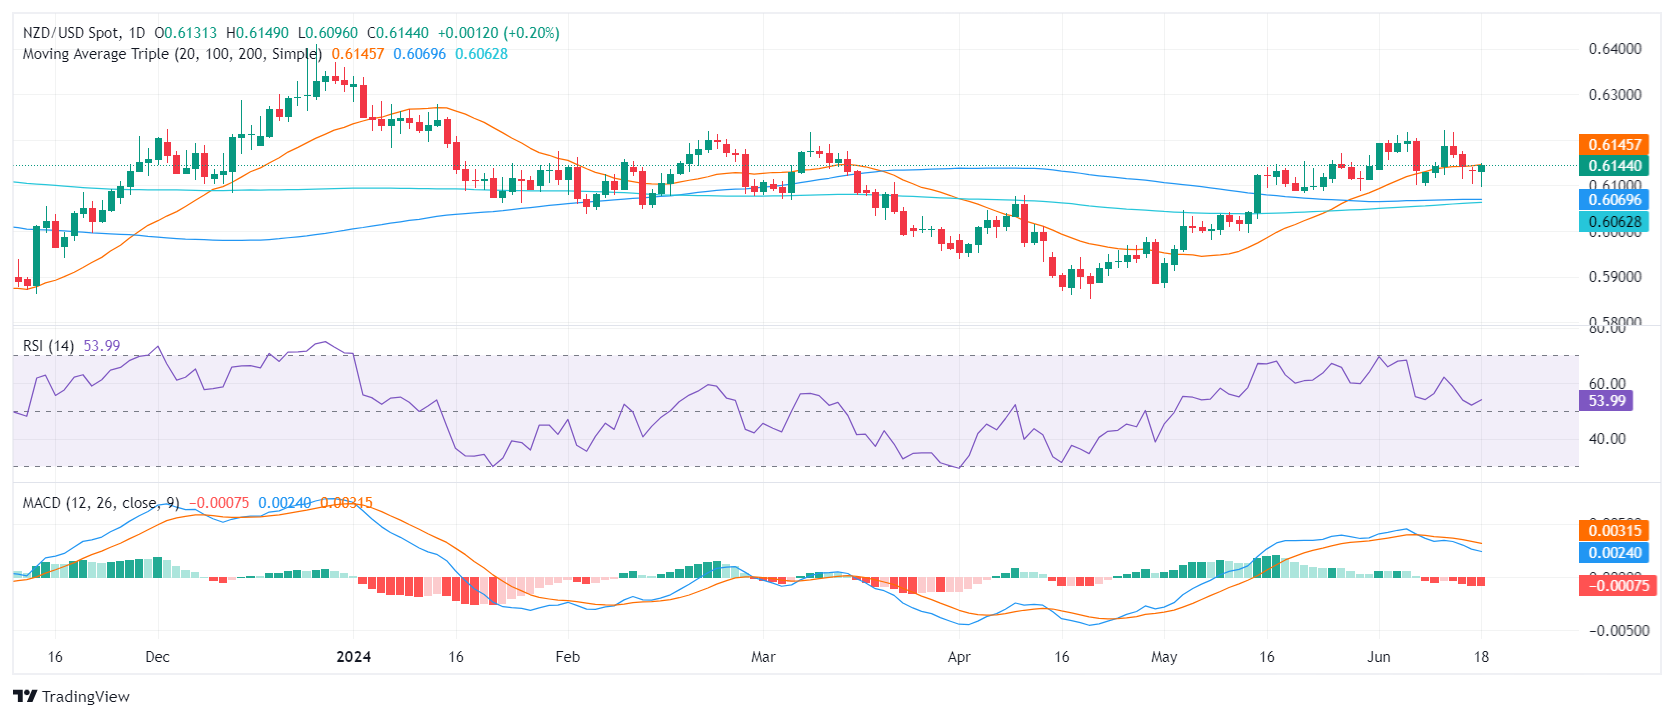
For the NZD/USD, the immediate support resides at 0.6100. Deeper support is available at the convergence of the 100-day and 200-day SMAs at 0.6069 and 0.6062 respectively, which can provide a solid footing for the pair in case of an extended downside move. A break below these SMA convergence points could point towards a huge sell signal.
In contrast, the pair's main resistance remains around the 20-day SMA at 0.6145 and above at the recent high at the 0.6220 level. A breakout above this consolidation range could be interpreted as a buy signal, suggesting the current bearish sentiment could be coming to an end.


© 2000-2026. Bản quyền Teletrade.
Trang web này được quản lý bởi Teletrade D.J. LLC 2351 LLC 2022 (Euro House, Richmond Hill Road, Kingstown, VC0100, St. Vincent and the Grenadines).
Thông tin trên trang web không phải là cơ sở để đưa ra quyết định đầu tư và chỉ được cung cấp cho mục đích làm quen.
Giao dịch trên thị trường tài chính (đặc biệt là giao dịch sử dụng các công cụ biên) mở ra những cơ hội lớn và tạo điều kiện cho các nhà đầu tư sẵn sàng mạo hiểm để thu lợi nhuận, tuy nhiên nó mang trong mình nguy cơ rủi ro khá cao. Chính vì vậy trước khi tiến hành giao dịch cần phải xem xét mọi mặt vấn đề chấp nhận tiến hành giao dịch cụ thể xét theo quan điểm của nguồn lực tài chính sẵn có và mức độ am hiểu thị trường tài chính.
Sử dụng thông tin: sử dụng toàn bộ hay riêng biệt các dữ liệu trên trang web của công ty TeleTrade như một nguồn cung cấp thông tin nhất định. Việc sử dụng tư liệu từ trang web cần kèm theo liên kết đến trang teletrade.vn. Việc tự động thu thập số liệu cũng như thông tin từ trang web TeleTrade đều không được phép.
Xin vui lòng liên hệ với pr@teletrade.global nếu có câu hỏi.
ngân hàng