- Phân tích
- Tin tức và các công cụ
- Tin tức thị trường
- AUD/JPY Price Analysis: Bulls propels pair near 105.00
AUD/JPY Price Analysis: Bulls propels pair near 105.00
- AUD/JPY got propelled near 105.00 on Tuesday, driven by the Reserve Bank of Australia RBA's hawkish hold.
- Tusaday's move confirms a positive short-term outlook.
- Fundamentals may have driven the pair out of the consolidation phase seen in the last sessions.
In Tuesday's session, the AUD/JPY pair received a boost following the Reserve Bank of Australia (RBA)'s hawkish hold, with the momentum propelling the pair towards the 105.00 level. In the last sessions, price action saw a consolidation above the 104.00 level, which supported the pair now to retest cycle highs.
On the daily scale, the Relative Strength Index (RSI) stands at 62, indicating rising buying pressure and shifting into bullish territory. However, it is important to observe that the Moving Average Convergence Divergence (MACD) line is below the signal line, hinting that there is still bearish activity. Traders will need to keep an eye on a possible crossover in the upcoming sessions to confirm the continuation of Tuesday's bullish movements.
AUD/JPY daily chart
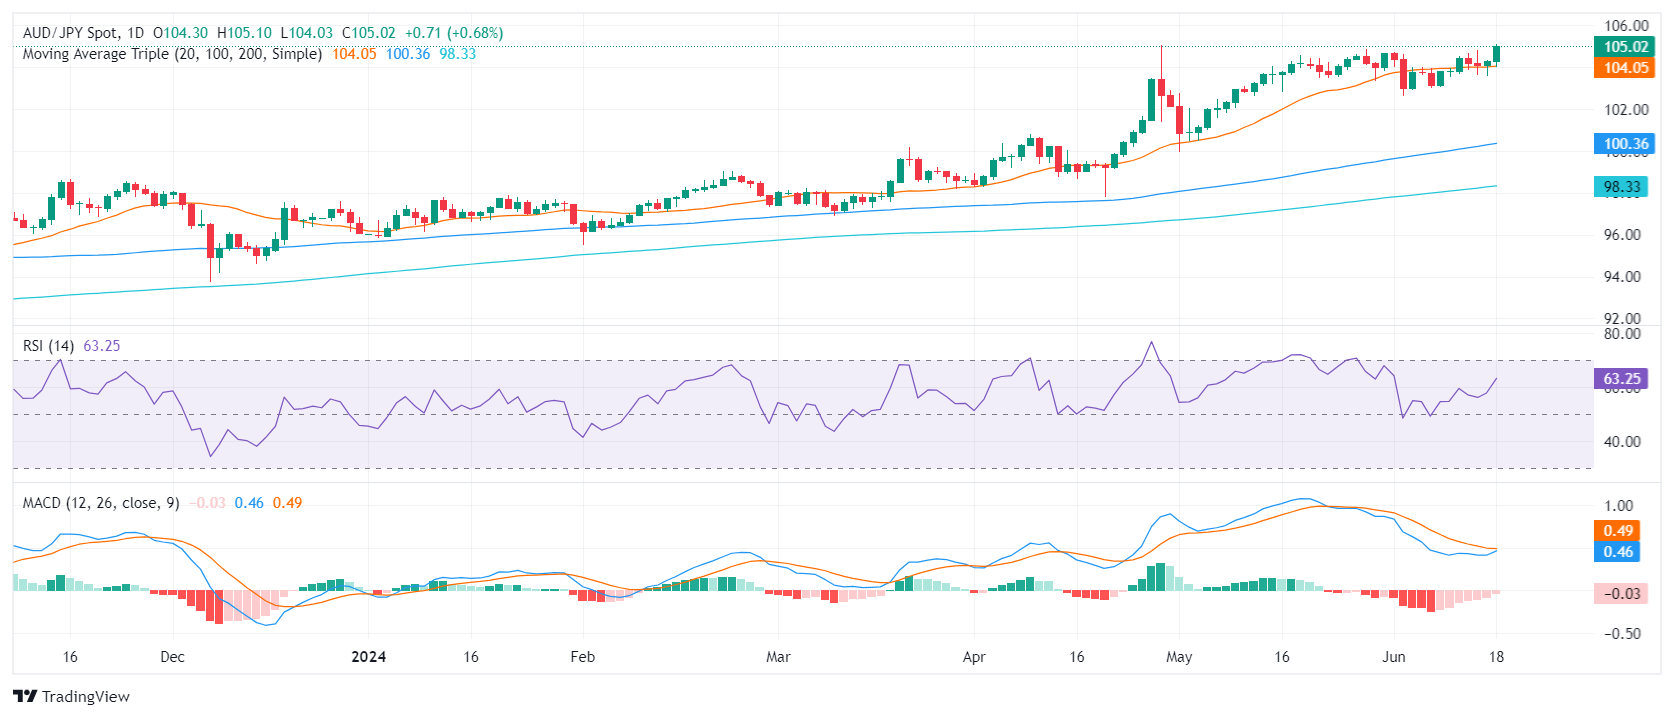
To sum it up, the AUD/JPY pair's solid performance on Tuesday supplements a broader bullish trend, with the trend's strength substantiated by the pair's value above the 20-day, 100-day, and 200-day SMAs. In the next sessions, traders can expect the pair to continue its uptrend movement within the 105.00-106.00 range as bulls have terrain to continue climbing with indicators far from overbought conditions.
On the flip side, if there is a breach below the established support level at 104.00 (20-day SMA), the pair may be prompted to find new support levels. The 102.50 and 100.35 levels are hence seen as the next potential support lines.


© 2000-2026. Bản quyền Teletrade.
Trang web này được quản lý bởi Teletrade D.J. LLC 2351 LLC 2022 (Euro House, Richmond Hill Road, Kingstown, VC0100, St. Vincent and the Grenadines).
Thông tin trên trang web không phải là cơ sở để đưa ra quyết định đầu tư và chỉ được cung cấp cho mục đích làm quen.
Giao dịch trên thị trường tài chính (đặc biệt là giao dịch sử dụng các công cụ biên) mở ra những cơ hội lớn và tạo điều kiện cho các nhà đầu tư sẵn sàng mạo hiểm để thu lợi nhuận, tuy nhiên nó mang trong mình nguy cơ rủi ro khá cao. Chính vì vậy trước khi tiến hành giao dịch cần phải xem xét mọi mặt vấn đề chấp nhận tiến hành giao dịch cụ thể xét theo quan điểm của nguồn lực tài chính sẵn có và mức độ am hiểu thị trường tài chính.
Sử dụng thông tin: sử dụng toàn bộ hay riêng biệt các dữ liệu trên trang web của công ty TeleTrade như một nguồn cung cấp thông tin nhất định. Việc sử dụng tư liệu từ trang web cần kèm theo liên kết đến trang teletrade.vn. Việc tự động thu thập số liệu cũng như thông tin từ trang web TeleTrade đều không được phép.
Xin vui lòng liên hệ với pr@teletrade.global nếu có câu hỏi.
ngân hàng