- Phân tích
- Tin tức và các công cụ
- Tin tức thị trường
- WTI Oil Price Analysis: Closing in on cluster of resistance in the $79.00s
WTI Oil Price Analysis: Closing in on cluster of resistance in the $79.00s
- Oil is rising up to a cluster of daily major moving averages in the $79.00s.
- These will probably present a tough level of resistance for the commodity.
- The persistence of the short-term uptrend will depend on a decisive break of this resistance barrier.
WTI Oil is trading in the $78.50s during the US session on Friday.
On the 4-hour chart used to assess the short-term trend Oil has decisively broken out a falling channel and reached the conservative target for the breakout at $78.17 (Fibonacci 0.618 extension of the width of the channel extrapolated higher).
Oil 4-Hour Chart
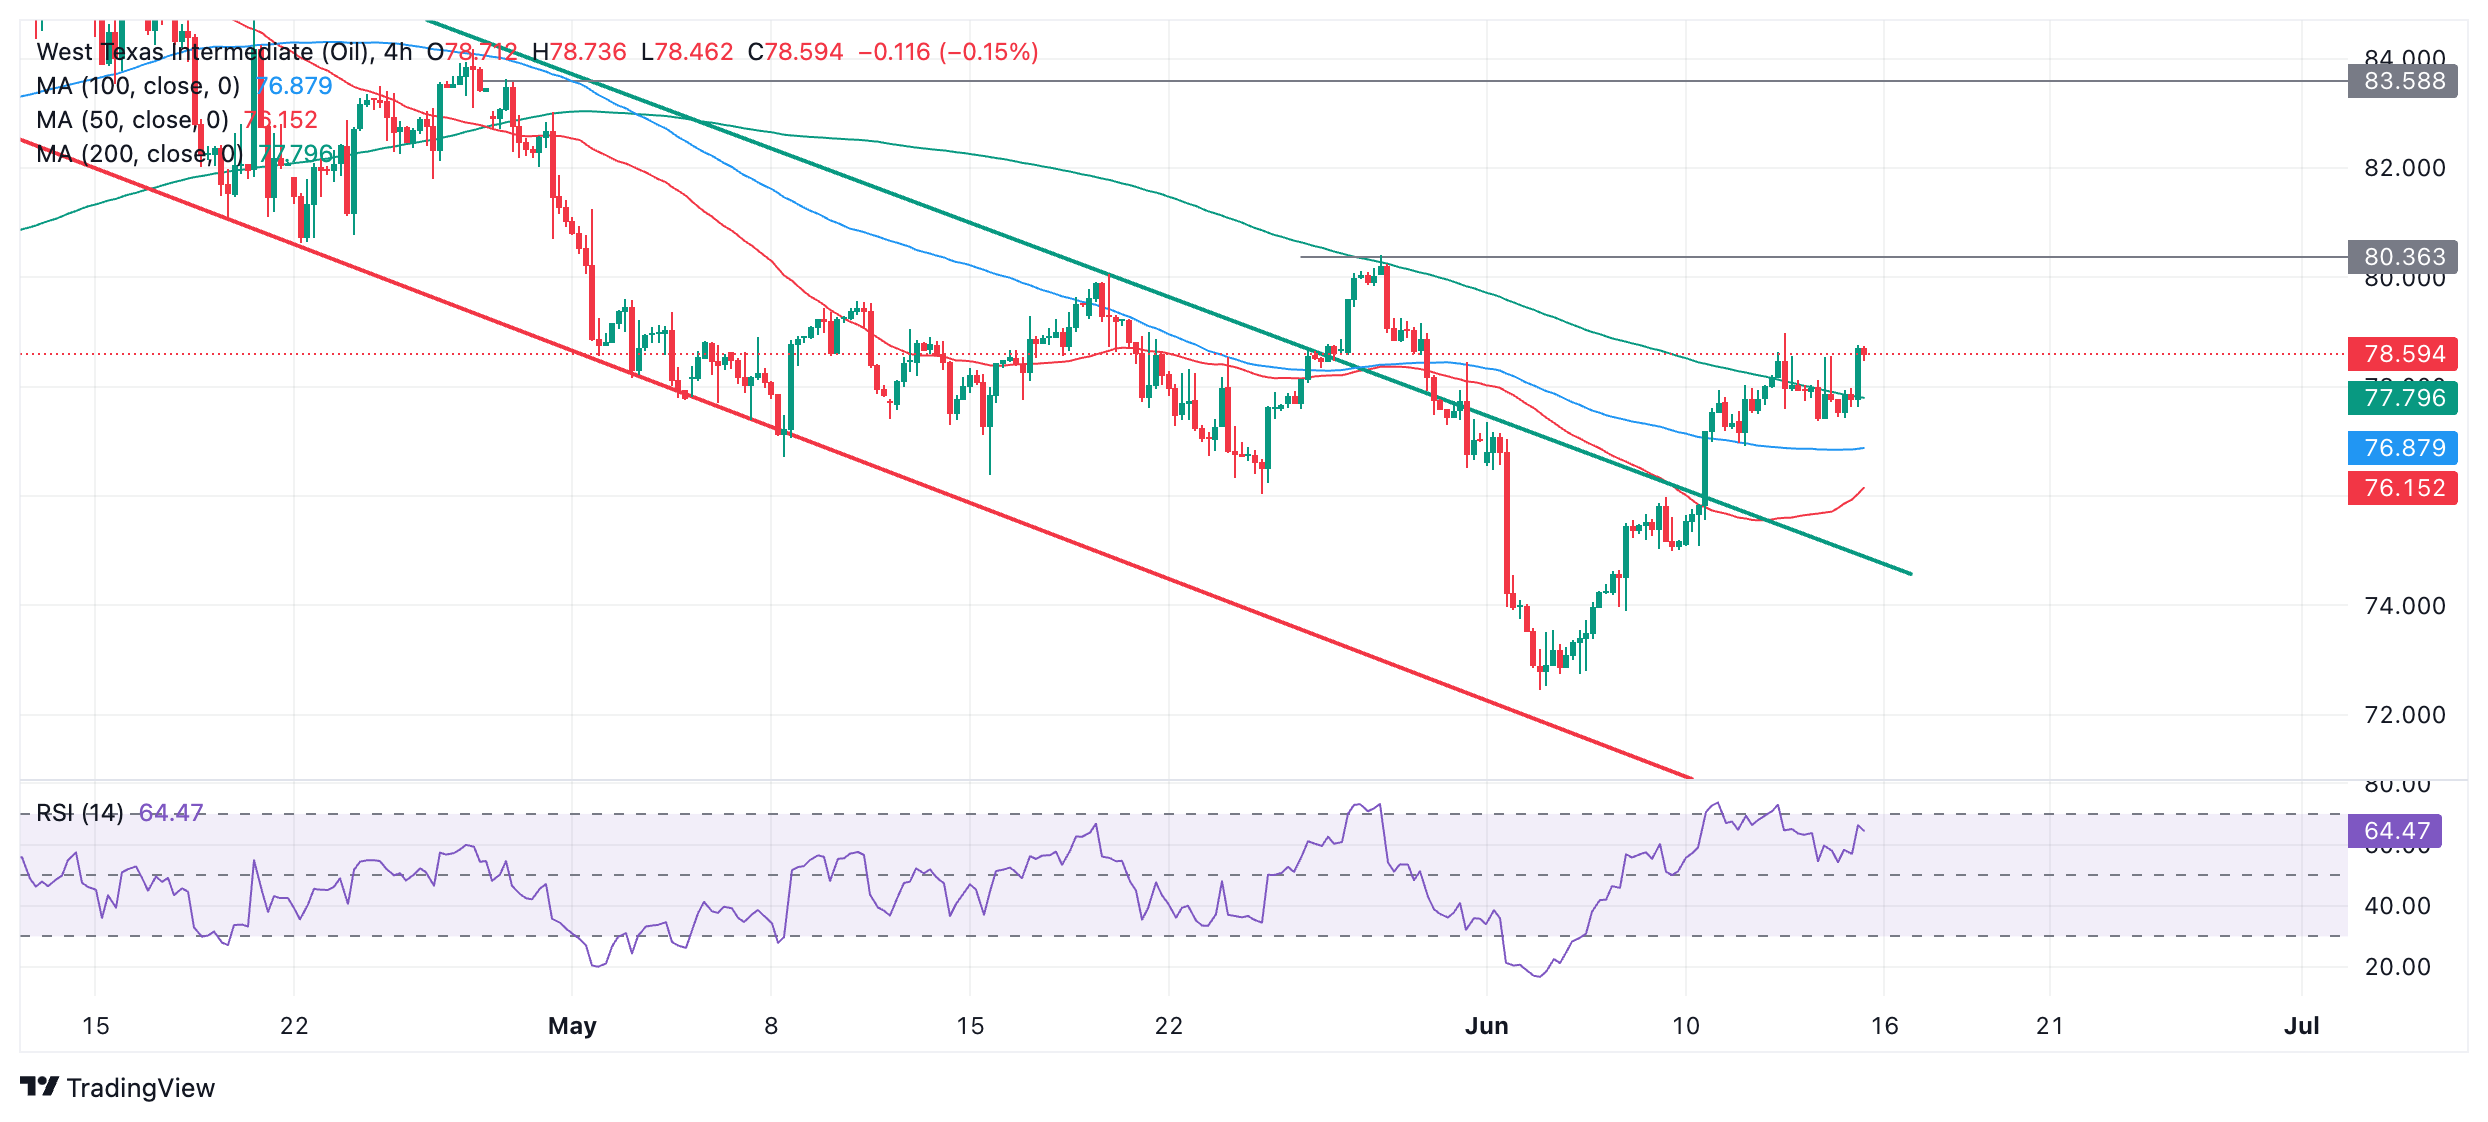
Since breaking out of the channel, Oil is probably now in a short-term uptrend with the odds favoring more upside in the short-term, given “the trend is your friend”. However, it has now reached its initial target so is vulnerable to a pullback.
A breakout above the last lower high of the prior downtrend at $80.36 (May 29 high) would provide added bullish confirmation and extend the uptrend higher. Such a move might be expected to reach the next key target at $83.50 (April 29 high and top of chart gap).
The direction of Oil is less clear on the daily chart used to assess the intermediate term trend.
Oil Daily Chart
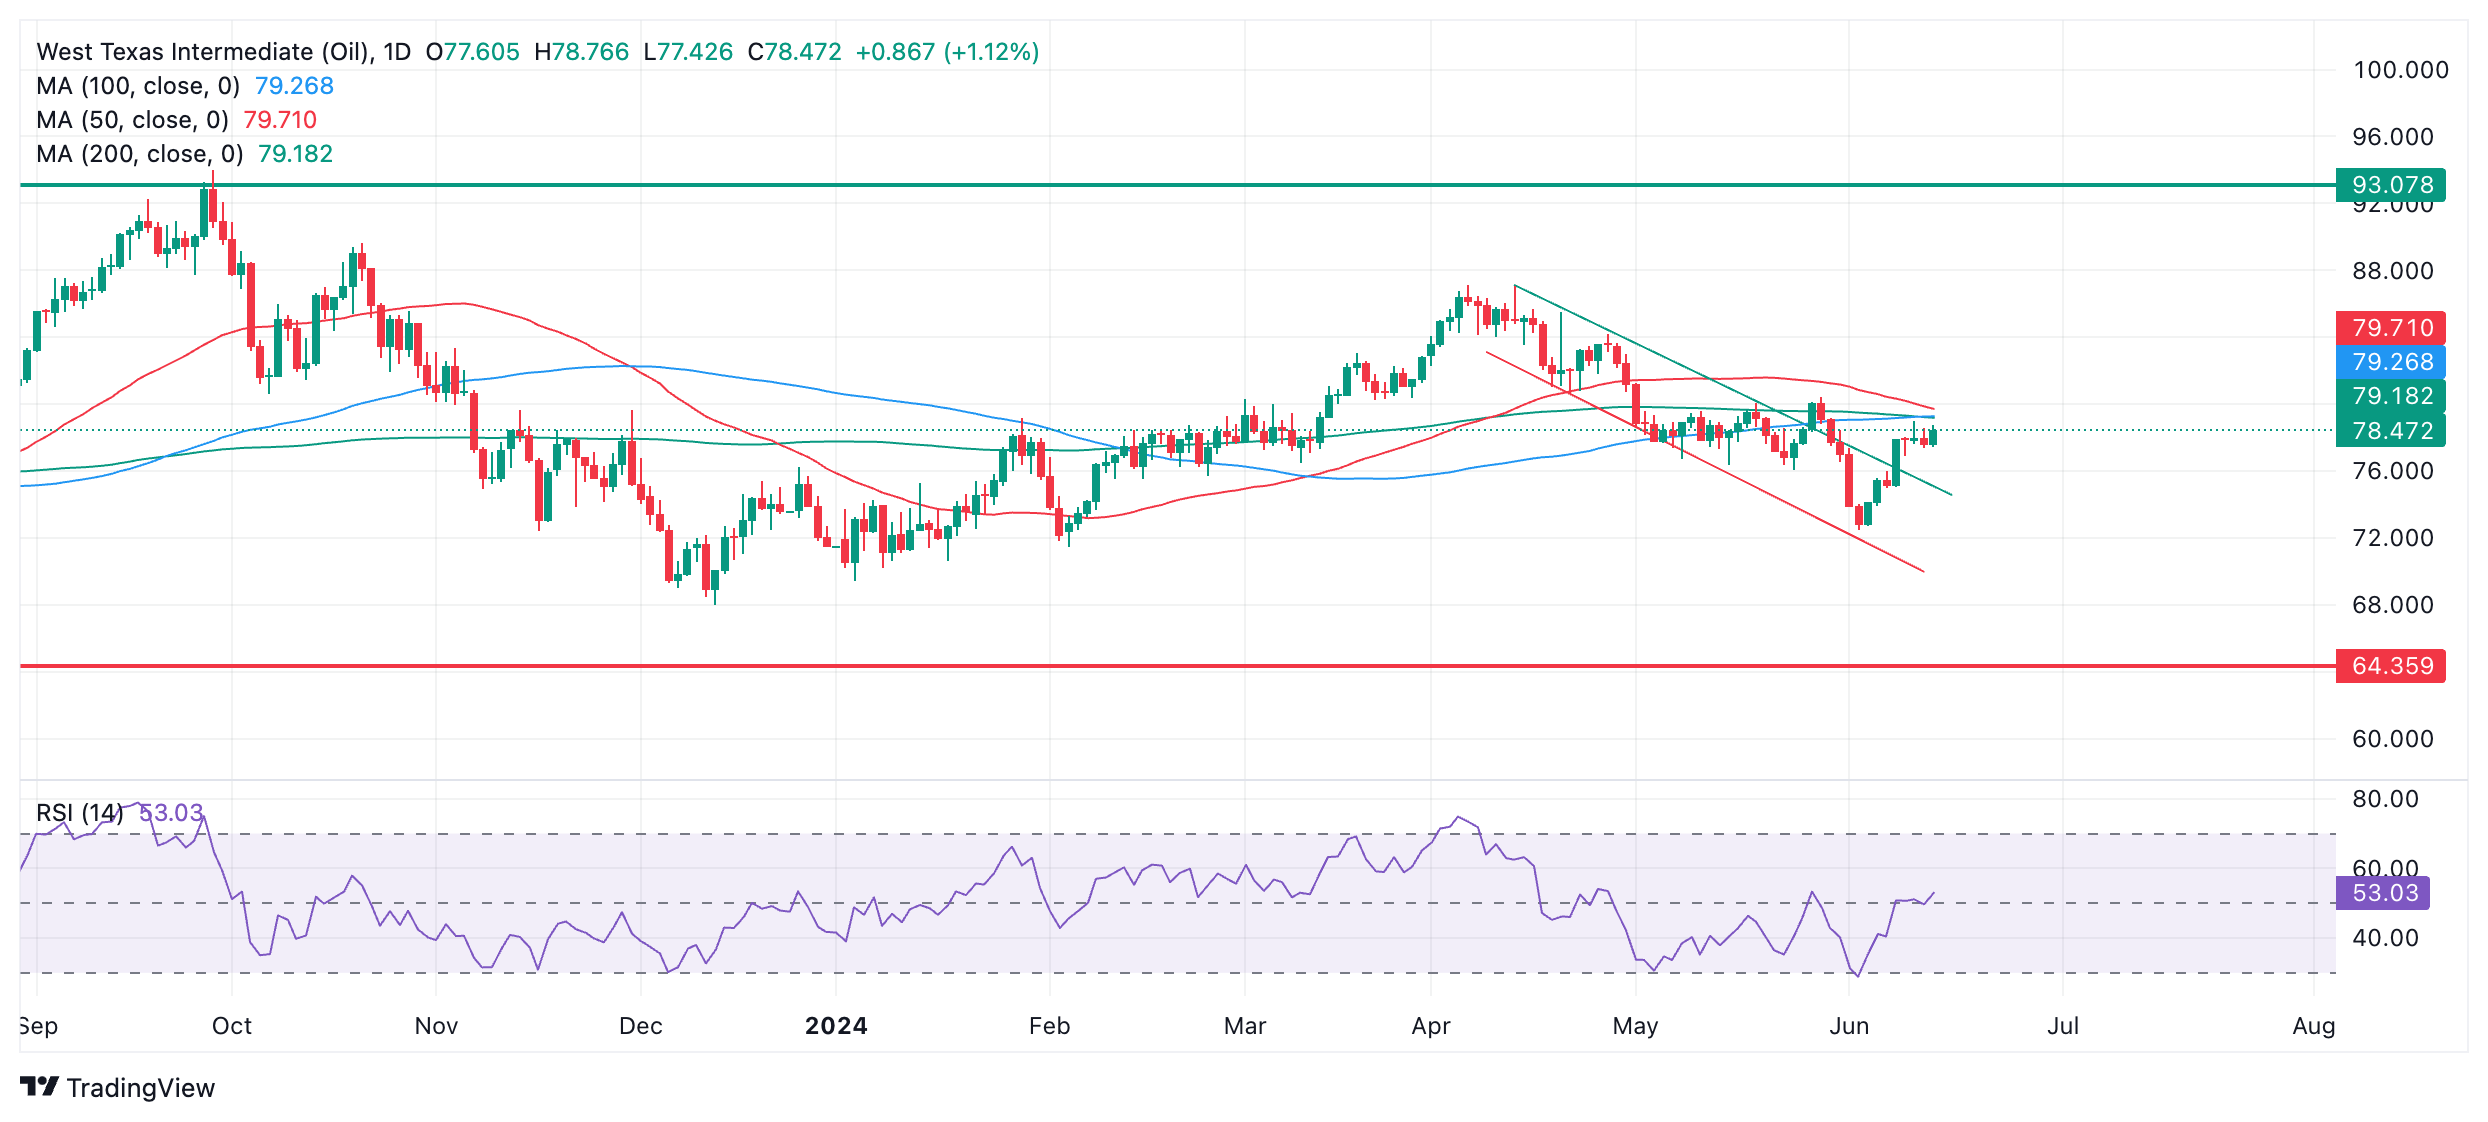
The key feature on the daily chart is the cluster of resistance in the $79s from all three major Simple Moving Averages (SMA) – the 50, 100 and 200-day SMAs. This is likely to present a considerable barrier to more upside and could be an inflection point for Oil price.
It would require a close on a daily basis above $80.36 (May 29 high) to confirm a successful break above resistance from the three SMAs and a continuation up to a target at $83.50.
WTI Oil appears to be trading within a broad long-term range between $64.00 and $93.00 on the weekly chart. This suggests the long-term trend is probably sideways.
Oil Weekly Chart
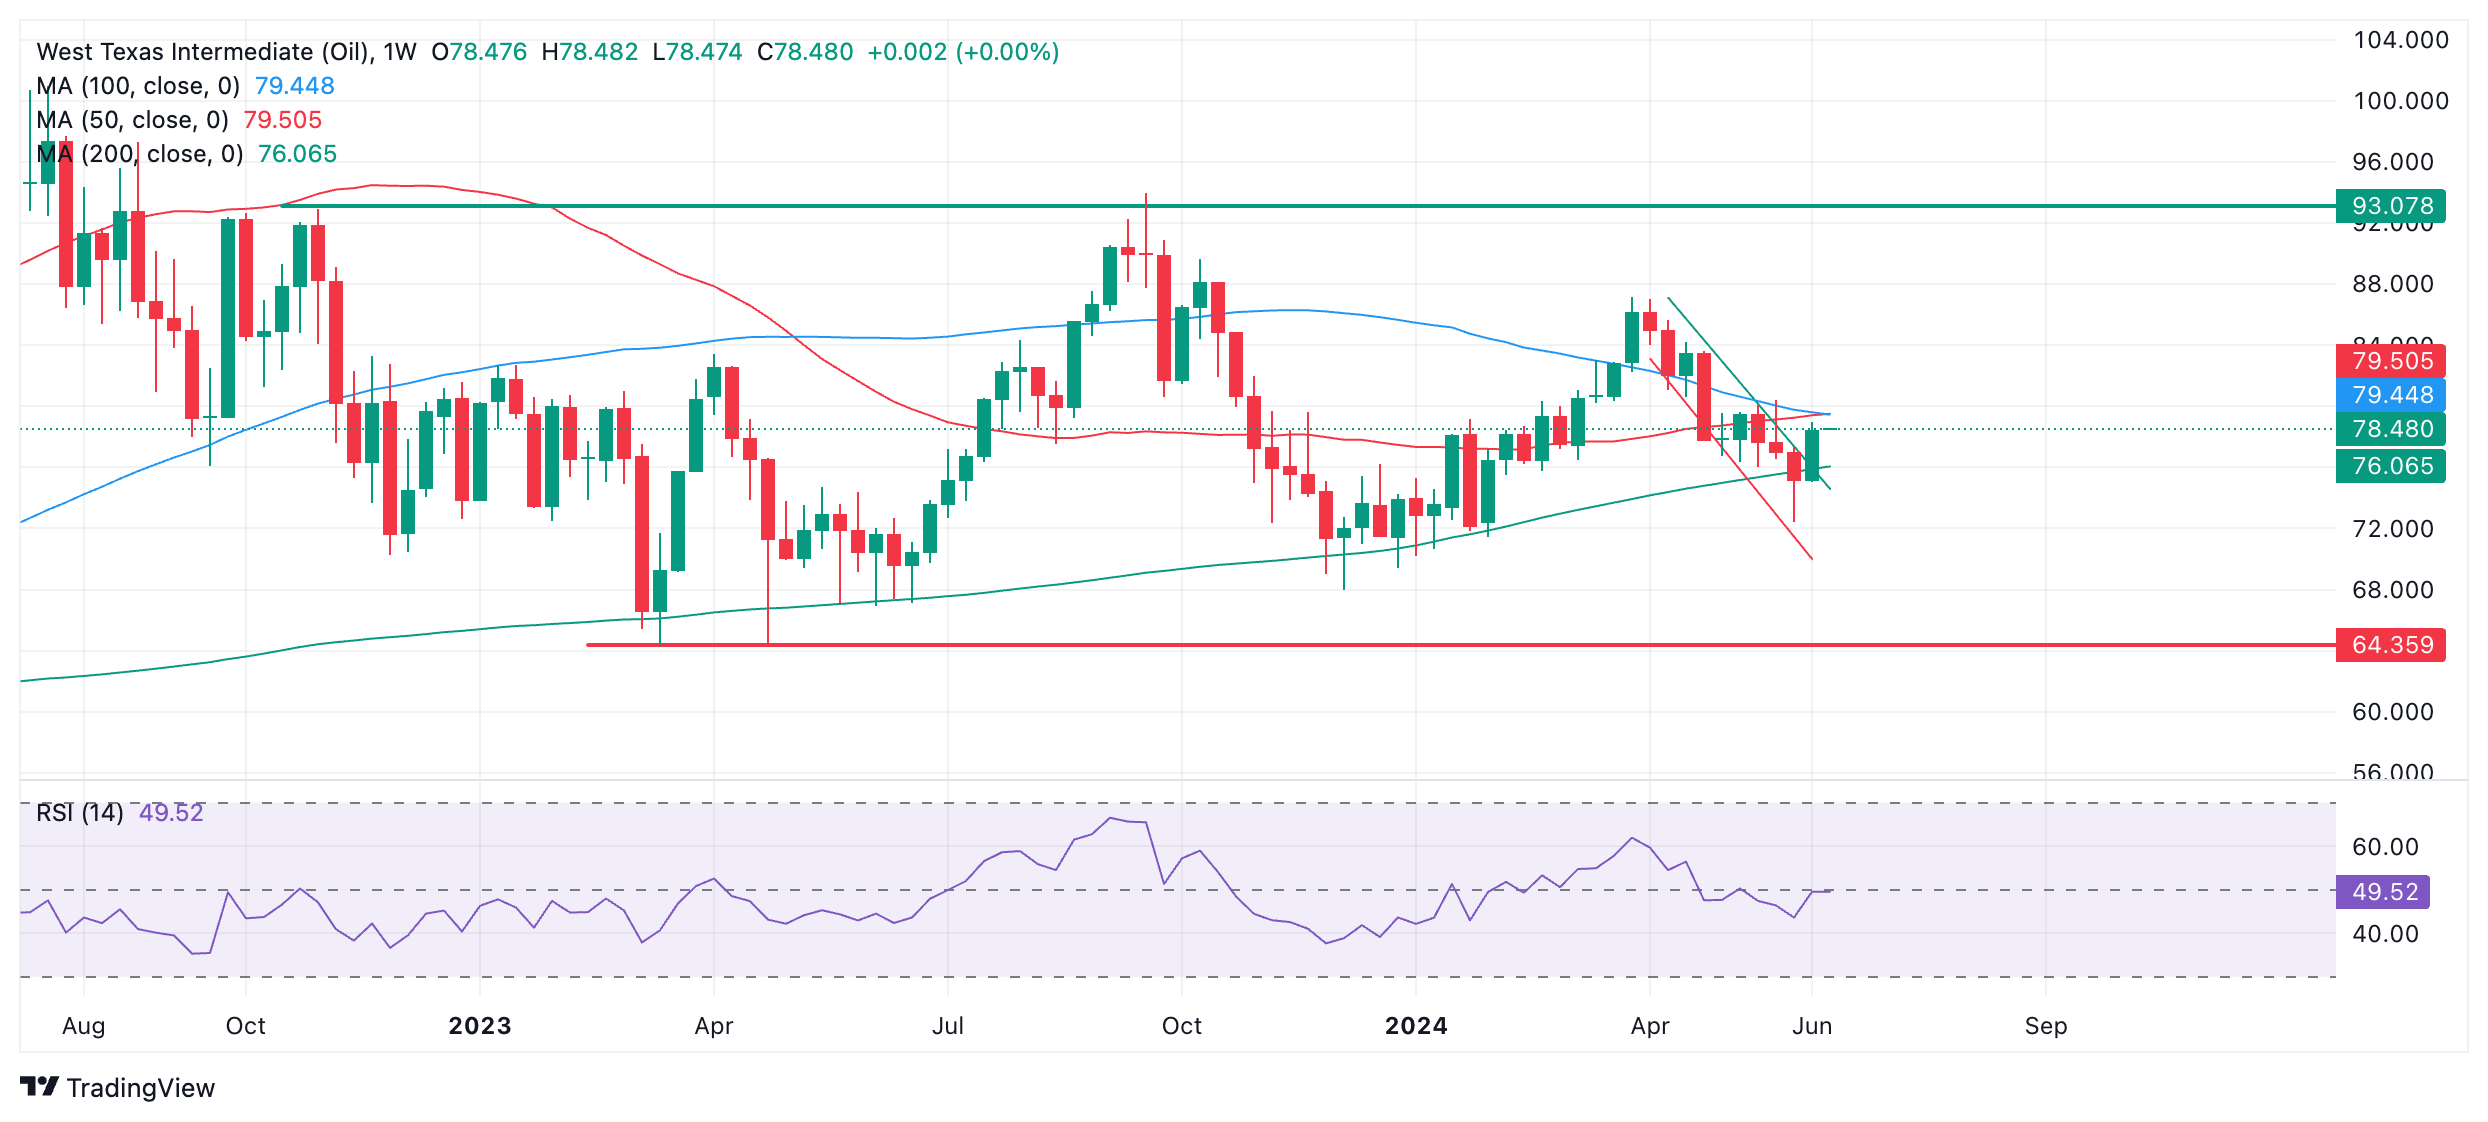
Last week’s red club-shaped candlestick could be a sign the move down has completed and Oil price may be reversing. Similarly-shaped candlesticks often punctuate the end of down moves in asset prices. It is possible Oil price could be about to begin a bullish sequence higher.
The 200-week SMA has acted as reliable support on multiple occasions in 2023-24 and is providing support again at the current week’s lows. The reliability of the 200-week SMA further enhances the case for a bullish reversal.


© 2000-2026. Bản quyền Teletrade.
Trang web này được quản lý bởi Teletrade D.J. LLC 2351 LLC 2022 (Euro House, Richmond Hill Road, Kingstown, VC0100, St. Vincent and the Grenadines).
Thông tin trên trang web không phải là cơ sở để đưa ra quyết định đầu tư và chỉ được cung cấp cho mục đích làm quen.
Giao dịch trên thị trường tài chính (đặc biệt là giao dịch sử dụng các công cụ biên) mở ra những cơ hội lớn và tạo điều kiện cho các nhà đầu tư sẵn sàng mạo hiểm để thu lợi nhuận, tuy nhiên nó mang trong mình nguy cơ rủi ro khá cao. Chính vì vậy trước khi tiến hành giao dịch cần phải xem xét mọi mặt vấn đề chấp nhận tiến hành giao dịch cụ thể xét theo quan điểm của nguồn lực tài chính sẵn có và mức độ am hiểu thị trường tài chính.
Sử dụng thông tin: sử dụng toàn bộ hay riêng biệt các dữ liệu trên trang web của công ty TeleTrade như một nguồn cung cấp thông tin nhất định. Việc sử dụng tư liệu từ trang web cần kèm theo liên kết đến trang teletrade.vn. Việc tự động thu thập số liệu cũng như thông tin từ trang web TeleTrade đều không được phép.
Xin vui lòng liên hệ với pr@teletrade.global nếu có câu hỏi.
ngân hàng