- Phân tích
- Tin tức và các công cụ
- Tin tức thị trường
- Gold trades in familiar territory amid mixed signals from US economy
Gold trades in familiar territory amid mixed signals from US economy
- Gold continues to trade in a range established in spring as traders respond to mixed macroeconomic signals.
- Whilst the data points to a fall in inflation, Fed officials are more cautious.
- XAU/USD has probably formed a bearish Head-and-Shoulders pattern on the daily chart.
Gold (XAU/USD) trades marginally higher on Friday, exchanging hands just above the $2,300 mark during the early European session. Asian bourses lacked directionality overnight and mixed signals from the US regarding the future path of interest rates – a key driver for Gold – are doing little to help establish directionality for the precious metal.
Gold stuck in a range during period of uncertainty
Gold yo-yos in familiar territory as conflicting signals leave traders guessing. This is especially true about the future course of interest rates in the US.
Whilst the country’s economic data points to a disinflationary trend, which would be expected to lead to lower interest rates, the central bankers tasked with making the cuts are acting more cautious. Lower interest rates would be a positive catalyst for Gold as they would reduce the opportunity cost of holding the non-yielding asset. However, it is unclear when and by how much rates will fall.
The release of disinflationary US Producer Price Index (PPI) data on Thursday, the market’s gauge of “factory gate” price growth, provided more evidence of a reduction in inflationary pressures, suggesting the Federal Reserve (Fed) could move to cut interest rates in the near-term.
Yet the data came after the Fed on Wednesday revised down – from three to one – the number of interest-rate cuts it expects to make in 2024 In addition, Fed Chairman Jerome Powell dismissed the importance of the cooler-than-expected Consumer Price Index (CPI) data in May, released only a few hours earlier, saying it was only one data point, and endorsing a data-dependent approach going forward.
Gold price itself rose over half a percent to a peak of $2,342 after the disinflationary CPI release, before backtracking on the Fed’s more cautious stance.
The CPI data balanced out robust US Nonfarm Payrolls (NFP) figures on Friday, which reflected a buoyant labor market and rising wages in the US. These factors would be expected to put upside pressure on inflation, keeping interest rates high.
Gold has also been left reeling after the People’s Bank of China (PBoC) revealed they had stopped buying the precious metal between the end of April and May. It was the first time in 18-months the PBoC had not added to their Gold reserves and suggested a price cap might have been reached. At the same, analysts at Citibank point to continued strong demand from consumers in China, which they say will push Gold higher.
Thus the overall picture remains mixed for Gold traders as they await the next main data release from the US on Friday, the preliminary Michigan Consumer Sentiment Index for June.
Technical Analysis: Gold forms Head-and-Shoulders top
Gold continues to form what looks like a bearish Head-and-Shoulders (H&S) price pattern. H&Ss tend to occur at market tops and signal a change of trend.
XAU/USD Daily Chart
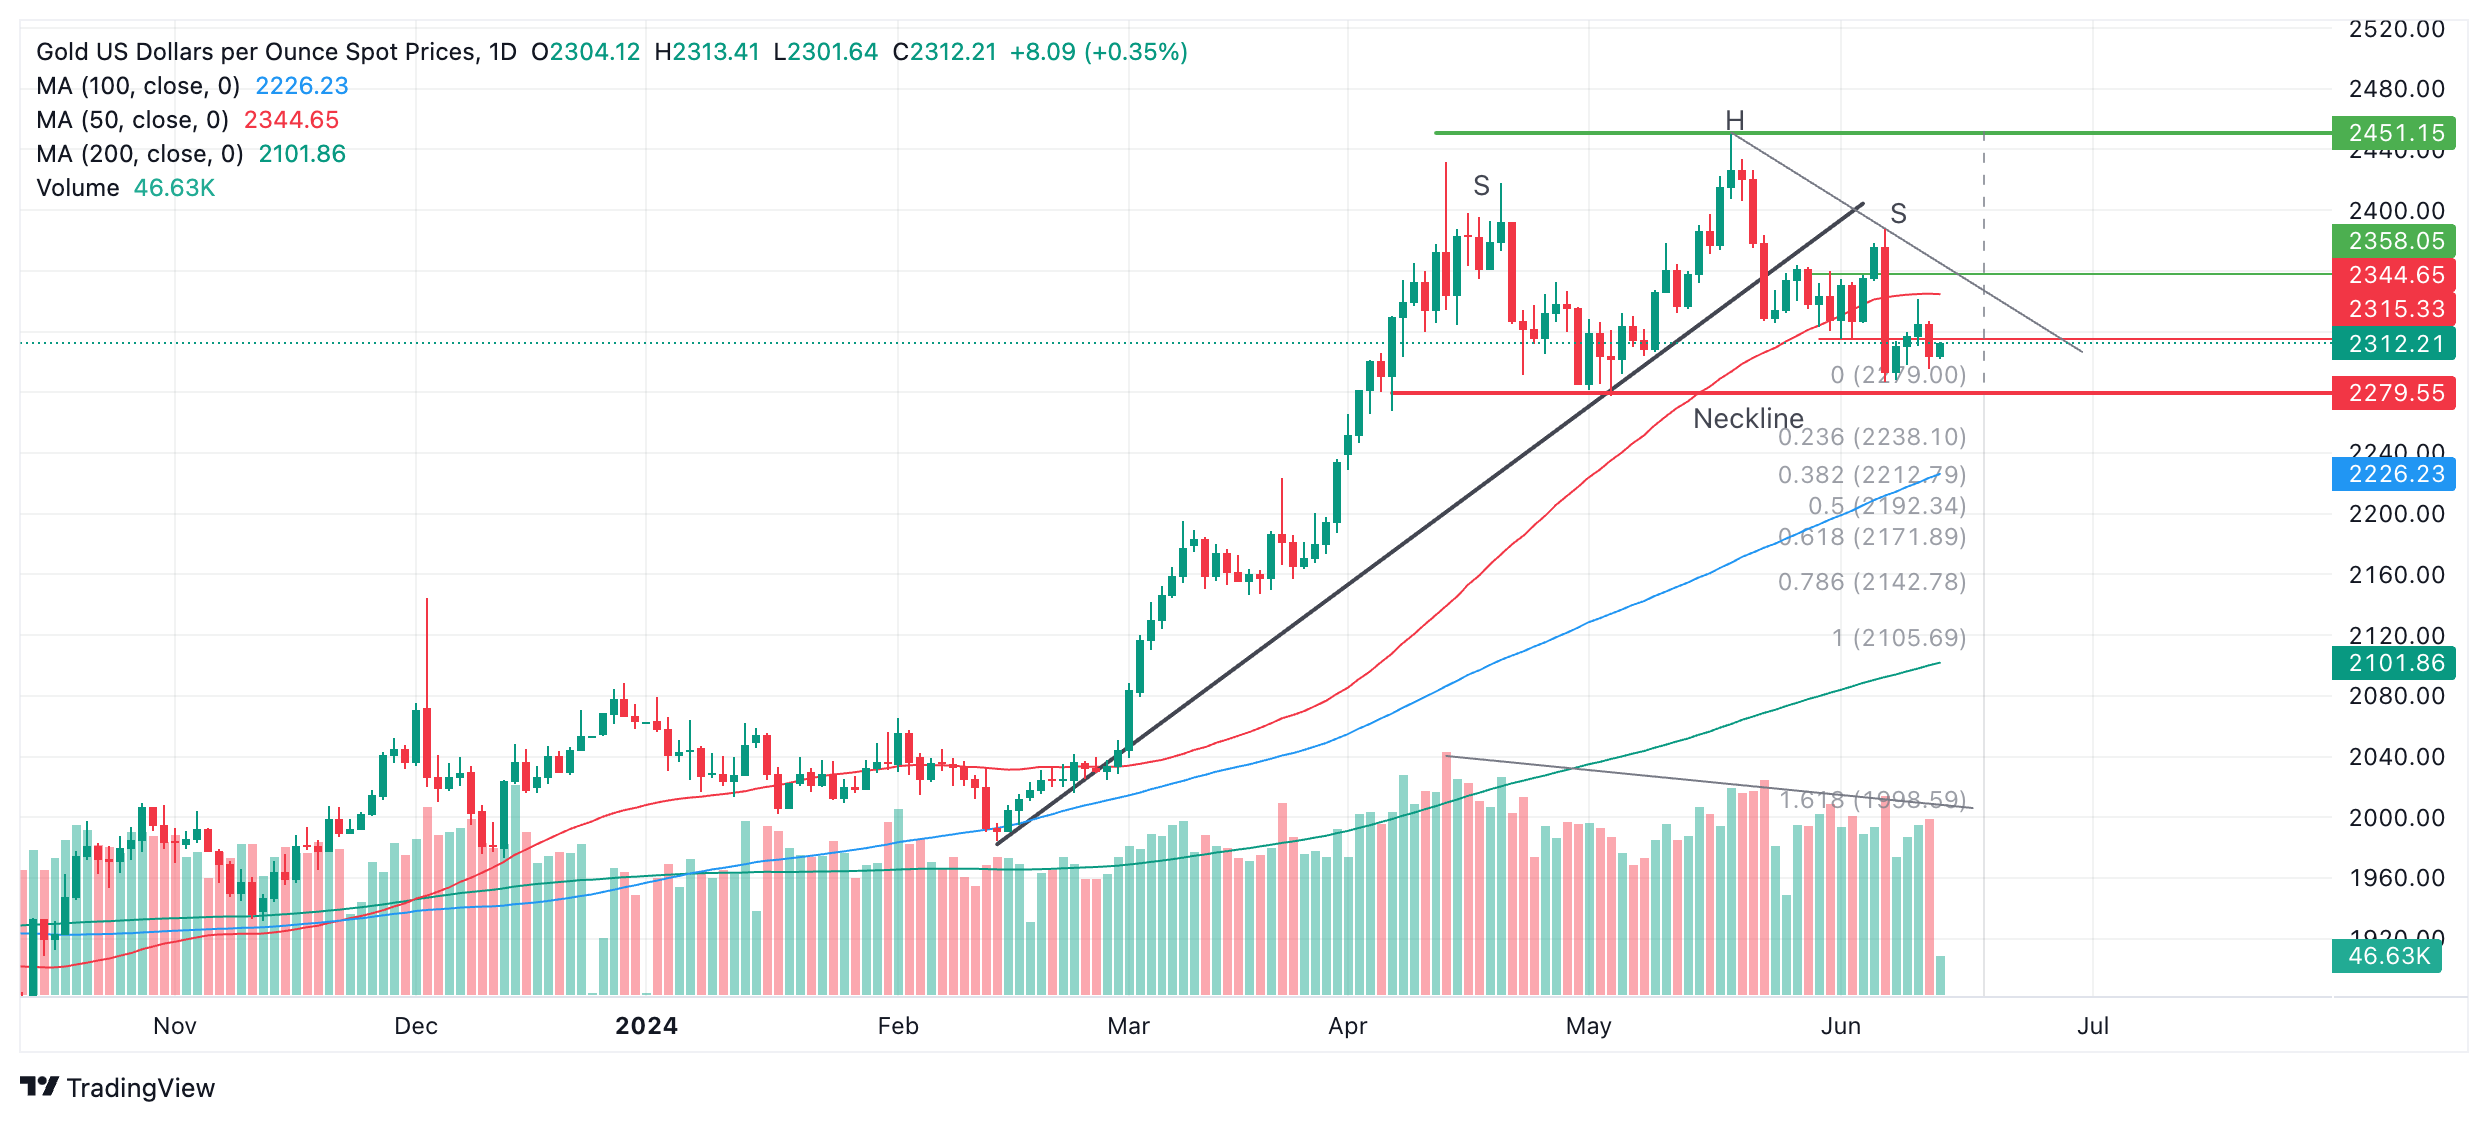
The H&S on Gold has completed a left and right shoulder (labeled “S”) and a “head” (labeled “H”). The so-called “neckline” of the pattern appears to be at the $2,279 support level (red line).
Declining trade volume during its development corroborates the pattern.
A decisive break below the neckline would validate the H&S pattern and activate downside targets. The first, more conservative, target would be $2,171, calculated by taking the 0.618 Fibonacci ratio of the height of the pattern and extrapolating it lower from the neckline. The second target would be at $2,106, the full height of the pattern extrapolated lower.
A break above $2,345, however, would bring the H&S into doubt and could signal a continuation higher, to an initial target at the $2,450 peak.
Economic Indicator
Producer Price Index ex Food & Energy (YoY)
The Producer Price Index ex Food & energy released by the Bureau of Labor statistics, Department of Labor measures the average changes in prices in primary markets of the US by producers of commodities in all states of processing. Those volatile products such as food and energy are excluded in order to capture an accurate calculation. Generally speaking, a high reading is seen as positive (or bullish) for the USD, whereas a low reading is seen as negative (or bearish).
Read more.Last release: Thu Jun 13, 2024 12:30
Frequency: Monthly
Actual: 2.3%
Consensus: 2.4%
Previous: 2.4%
Source: US Bureau of Labor Statistics


© 2000-2026. Bản quyền Teletrade.
Trang web này được quản lý bởi Teletrade D.J. LLC 2351 LLC 2022 (Euro House, Richmond Hill Road, Kingstown, VC0100, St. Vincent and the Grenadines).
Thông tin trên trang web không phải là cơ sở để đưa ra quyết định đầu tư và chỉ được cung cấp cho mục đích làm quen.
Giao dịch trên thị trường tài chính (đặc biệt là giao dịch sử dụng các công cụ biên) mở ra những cơ hội lớn và tạo điều kiện cho các nhà đầu tư sẵn sàng mạo hiểm để thu lợi nhuận, tuy nhiên nó mang trong mình nguy cơ rủi ro khá cao. Chính vì vậy trước khi tiến hành giao dịch cần phải xem xét mọi mặt vấn đề chấp nhận tiến hành giao dịch cụ thể xét theo quan điểm của nguồn lực tài chính sẵn có và mức độ am hiểu thị trường tài chính.
Sử dụng thông tin: sử dụng toàn bộ hay riêng biệt các dữ liệu trên trang web của công ty TeleTrade như một nguồn cung cấp thông tin nhất định. Việc sử dụng tư liệu từ trang web cần kèm theo liên kết đến trang teletrade.vn. Việc tự động thu thập số liệu cũng như thông tin từ trang web TeleTrade đều không được phép.
Xin vui lòng liên hệ với pr@teletrade.global nếu có câu hỏi.
ngân hàng