- Phân tích
- Tin tức và các công cụ
- Tin tức thị trường
- AUD/JPY Price Analysis: Bulls take a breather, sellers test the 20-day SMA support
AUD/JPY Price Analysis: Bulls take a breather, sellers test the 20-day SMA support
- The AUD/JPY pair is experiencing a decline as buyers take profits, causing it to hover around the 20-day SMA.
- In spite of the drop, the pair remains in consolidation, suggesting the possibility of a limited decline for the time being.
- If the bulls are successful in building support around the 20-day SMA, the next potential target lies within the 104.50-105.00 price range.
In Thursday's session, the AUD/JPY pair witnessed a dip towards 104.00 as buyers cashed in their profits, which saw the pair soaring above the 20-day Simple Moving Average (SMA). The 20-day SMA, which previously acted as a point of resistance, seems to be the new focus point for building support in order to lessen further losses. Nevertheless, the persistent consolidation phase suggests a lack of momentum for a steady rise.
The daily Relative Strength Index (RSI) of the AUDJPY now stands at 54, a decrease from the previous session's score of 57, indicating a slight downward trend and implying that the previous upward momentum may be losing steam. In contrast, the Moving Average Convergence Divergence (MACD) is exhibiting stationary red bars, indicative of a stabilizing momentum.
AUD/JPY daily chart
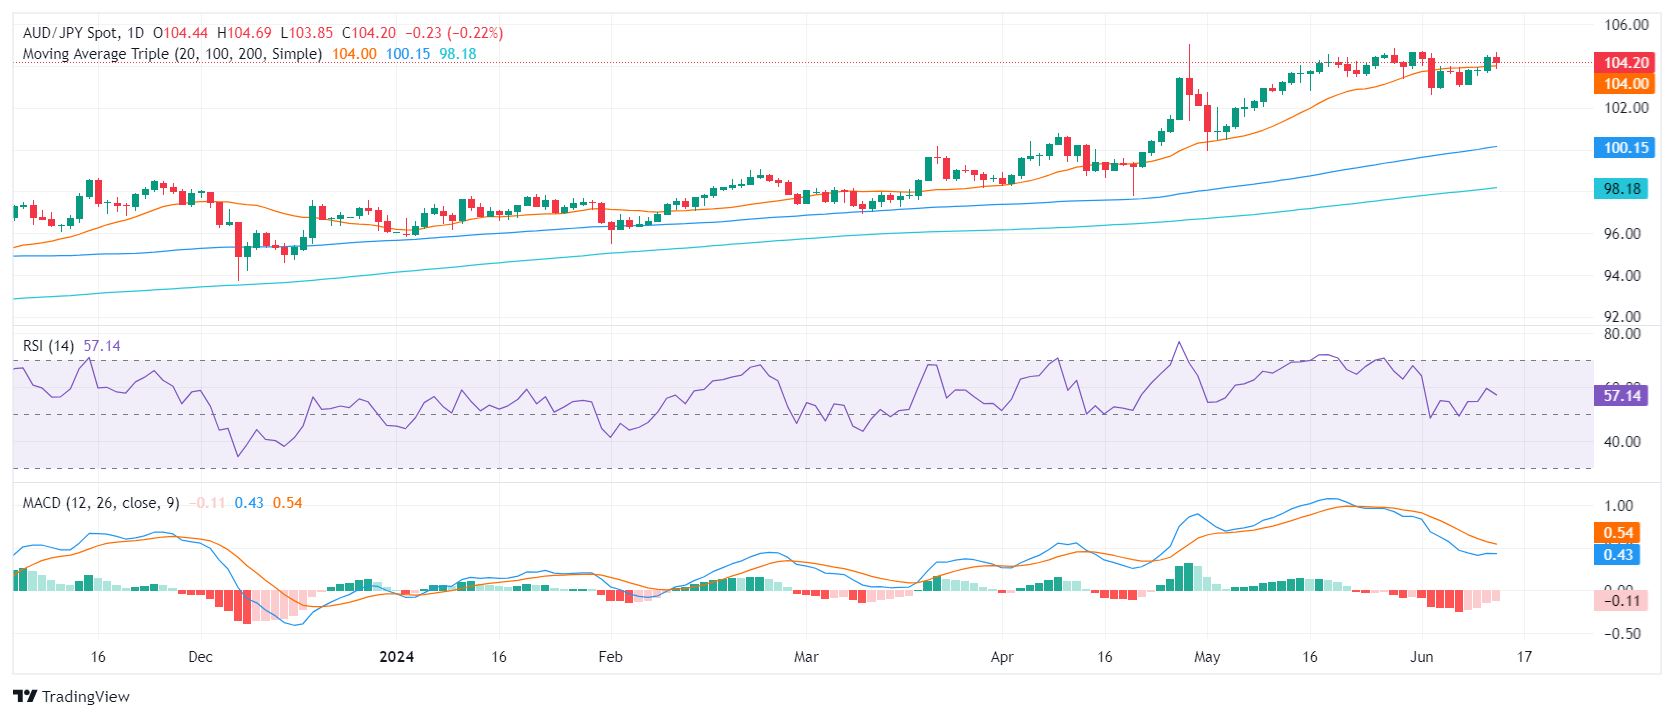 In conclusion, the AUD/JPY pair appears to be in a consolidation phase, despite a drop this Thursday as trading hovers around the 20-day SMA. The possible range of 102.00-103.00 for the upcoming sessions may denote the continuation of side-ways trading as bulls seem to be consolidating from the May rally which had lifted the pair near 105.00. Nonetheless, the reduction in selling momentum could represent a gearing up by the bulls for the next upward swing, potentially retesting the 104.50-105.00 area.


© 2000-2026. Bản quyền Teletrade.
Trang web này được quản lý bởi Teletrade D.J. LLC 2351 LLC 2022 (Euro House, Richmond Hill Road, Kingstown, VC0100, St. Vincent and the Grenadines).
Thông tin trên trang web không phải là cơ sở để đưa ra quyết định đầu tư và chỉ được cung cấp cho mục đích làm quen.
Giao dịch trên thị trường tài chính (đặc biệt là giao dịch sử dụng các công cụ biên) mở ra những cơ hội lớn và tạo điều kiện cho các nhà đầu tư sẵn sàng mạo hiểm để thu lợi nhuận, tuy nhiên nó mang trong mình nguy cơ rủi ro khá cao. Chính vì vậy trước khi tiến hành giao dịch cần phải xem xét mọi mặt vấn đề chấp nhận tiến hành giao dịch cụ thể xét theo quan điểm của nguồn lực tài chính sẵn có và mức độ am hiểu thị trường tài chính.
Sử dụng thông tin: sử dụng toàn bộ hay riêng biệt các dữ liệu trên trang web của công ty TeleTrade như một nguồn cung cấp thông tin nhất định. Việc sử dụng tư liệu từ trang web cần kèm theo liên kết đến trang teletrade.vn. Việc tự động thu thập số liệu cũng như thông tin từ trang web TeleTrade đều không được phép.
Xin vui lòng liên hệ với pr@teletrade.global nếu có câu hỏi.
ngân hàng