- Phân tích
- Tin tức và các công cụ
- Tin tức thị trường
- NZD/JPY Price Analysis: Cross reached multi-year highs, upside appears limited
NZD/JPY Price Analysis: Cross reached multi-year highs, upside appears limited
- Kiwi shows signs of fatigue against the Yen, after reaching highest level since June 2007 on Thursday.
- Indicators on the daily chart suggest potential further consolidation, with trading confined between 95.00 and 97.00.
- A retest of the 97.00 level is possible, but a breach is unlikely as buyers consolidate gains from the significant ascent in May.
On Thursday, the NZD/JPY pair exhibited signs of fatigue, following its advancement to the multi-year highs logged earlier in the week. Clearly, the technical landscape suggests an extension of the consolidation phase, potentially keeping the pair's upside movements capped below the psychological 97.00 level.
The daily Relative Strength Index (RSI) for NZD/JPY has slightly retreated to 59, indicative of a waning in the bullish momentum. The Moving Average Convergence Divergence (MACD) continues to print flat red bars, further endorsing the perspective of ongoing consolidation.
NZD/JPY daily chart
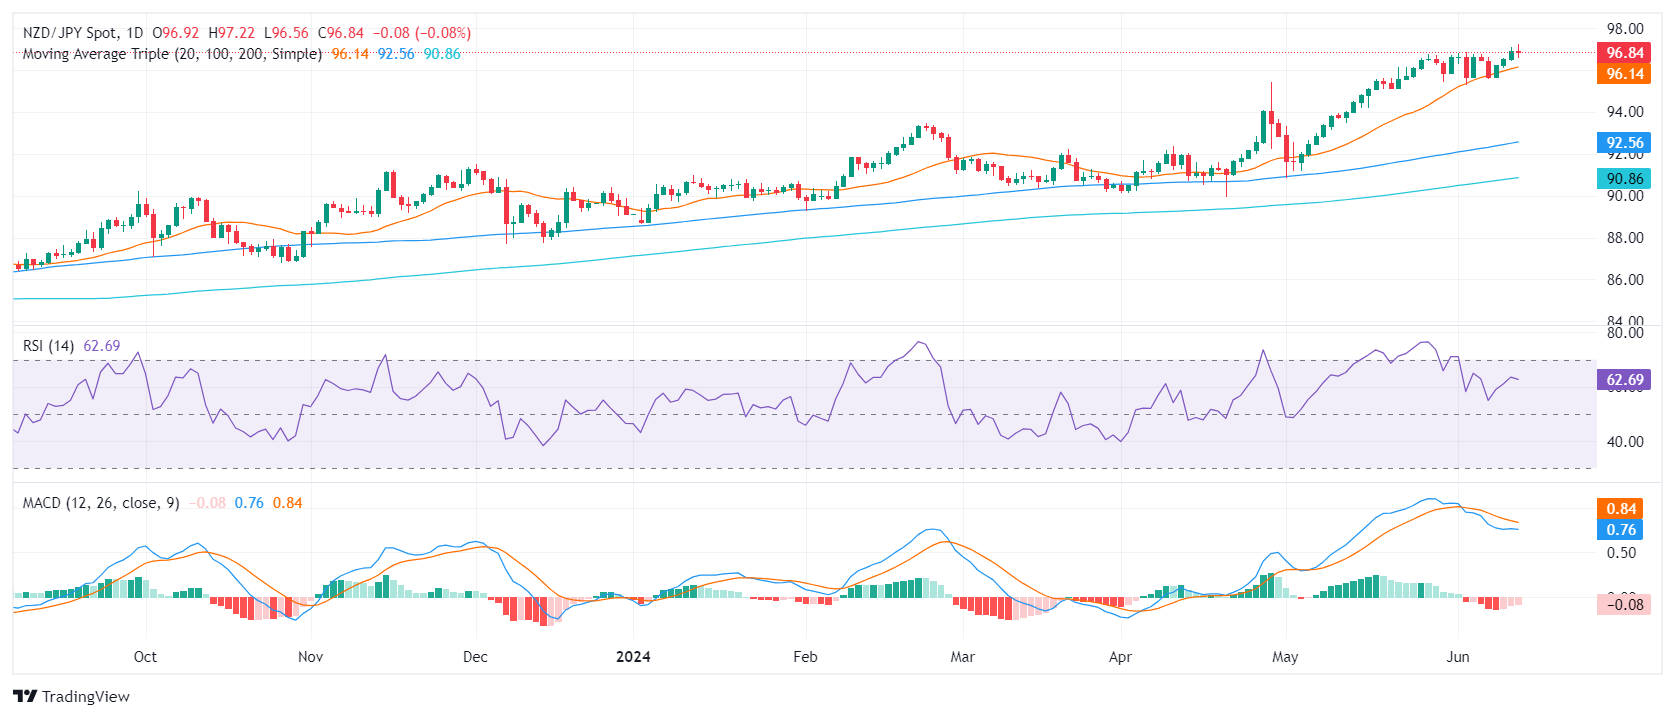 The continuous presence of buyers above the 20-day Simple Moving Average (SMA) indicates their effort to sustain the bullish push. Yet, the recent exhaustion signal demonstrated by the daily technical indicators supports the market's need to consolidate following the significant surge recorded in May. The upcoming trading sessions might see the pair oscillate between the 95.00 level, serving as support, and the 97.00 level, acting as resistance, as the pair looks to stabilize after recent gains.
The longer-term SMAs established around 90.00 - 92.00 safeguard the overall bullish complexion of the pair.


© 2000-2026. Bản quyền Teletrade.
Trang web này được quản lý bởi Teletrade D.J. LLC 2351 LLC 2022 (Euro House, Richmond Hill Road, Kingstown, VC0100, St. Vincent and the Grenadines).
Thông tin trên trang web không phải là cơ sở để đưa ra quyết định đầu tư và chỉ được cung cấp cho mục đích làm quen.
Giao dịch trên thị trường tài chính (đặc biệt là giao dịch sử dụng các công cụ biên) mở ra những cơ hội lớn và tạo điều kiện cho các nhà đầu tư sẵn sàng mạo hiểm để thu lợi nhuận, tuy nhiên nó mang trong mình nguy cơ rủi ro khá cao. Chính vì vậy trước khi tiến hành giao dịch cần phải xem xét mọi mặt vấn đề chấp nhận tiến hành giao dịch cụ thể xét theo quan điểm của nguồn lực tài chính sẵn có và mức độ am hiểu thị trường tài chính.
Sử dụng thông tin: sử dụng toàn bộ hay riêng biệt các dữ liệu trên trang web của công ty TeleTrade như một nguồn cung cấp thông tin nhất định. Việc sử dụng tư liệu từ trang web cần kèm theo liên kết đến trang teletrade.vn. Việc tự động thu thập số liệu cũng như thông tin từ trang web TeleTrade đều không được phép.
Xin vui lòng liên hệ với pr@teletrade.global nếu có câu hỏi.
ngân hàng