- Phân tích
- Tin tức và các công cụ
- Tin tức thị trường
- Crude Oil at risk of snapping recovery streak as markets head towards Wednesday’s Fed showing
Crude Oil at risk of snapping recovery streak as markets head towards Wednesday’s Fed showing
- WTI held onto recovery territory near $78.00 on Tuesday as markets draw tight.
- API reports a steeper-than-expected drawdown in weekly crude stocks.
- EIA follow-up reporting to get drowned out by Fed rate call.
West Texas Intermediate (WTI) US Crude Oil failed to extend an ongoing recovery on the back of renewed hopes of a global supply drawdown. Investor sentiment is buckling down for the wait to Wednesday’s latest Federal Reserve (Fed) rate call and update to the Fed’s “dot plot” of Interest Rate Expectations.
Despite investor sentiment drifting lower ahead of a key Fed outing on Wednesday, Crude Oil markets held steady after the American Petroleum Institute (API) reported a steeper-than-expected drawdown in Weekly Crude Oil Stocks. API Crude Oil stocks for the week ended June 7 contracted by 2.428 million barrels, steeper than the forecast -1.75 million drawdown and helping to eat away at the previous week’s 4.052 million barrel buildup.
Week-on-week Crude Oil Stocks Change counts from the Energy Information Administration (EIA) are due on Wednesday, but will likely get drowned out by a high-impact Fed showing and an update to US Consumer Price Index (CPI) inflation.
The Fed will be updating its Interest Rate Expectations, and investors will be huddled around the economic calendar looking for adjustments to the Fed’s “dot plot”. US CPI inflation is expected earlier Wednesday, and median market forecasts are hoping for MoM CPI inflation to cool to just 0.1% compared to the previous month’s 0.3%.
WTI technical outlook
WTI has recovered nearly 7.5% from recent lows near $72.50 per barrel, but intraday bullish momentum has hit a key technical barrier at $78.00 per barrel.
Long-term bullish momentum could run into a ceiling in short order if a descending trendline holds. A recovery into the $80.00 handle will also need to break and hold above the 200-day Exponential Moving Average (EMA) near $78.90.
WTI hourly chart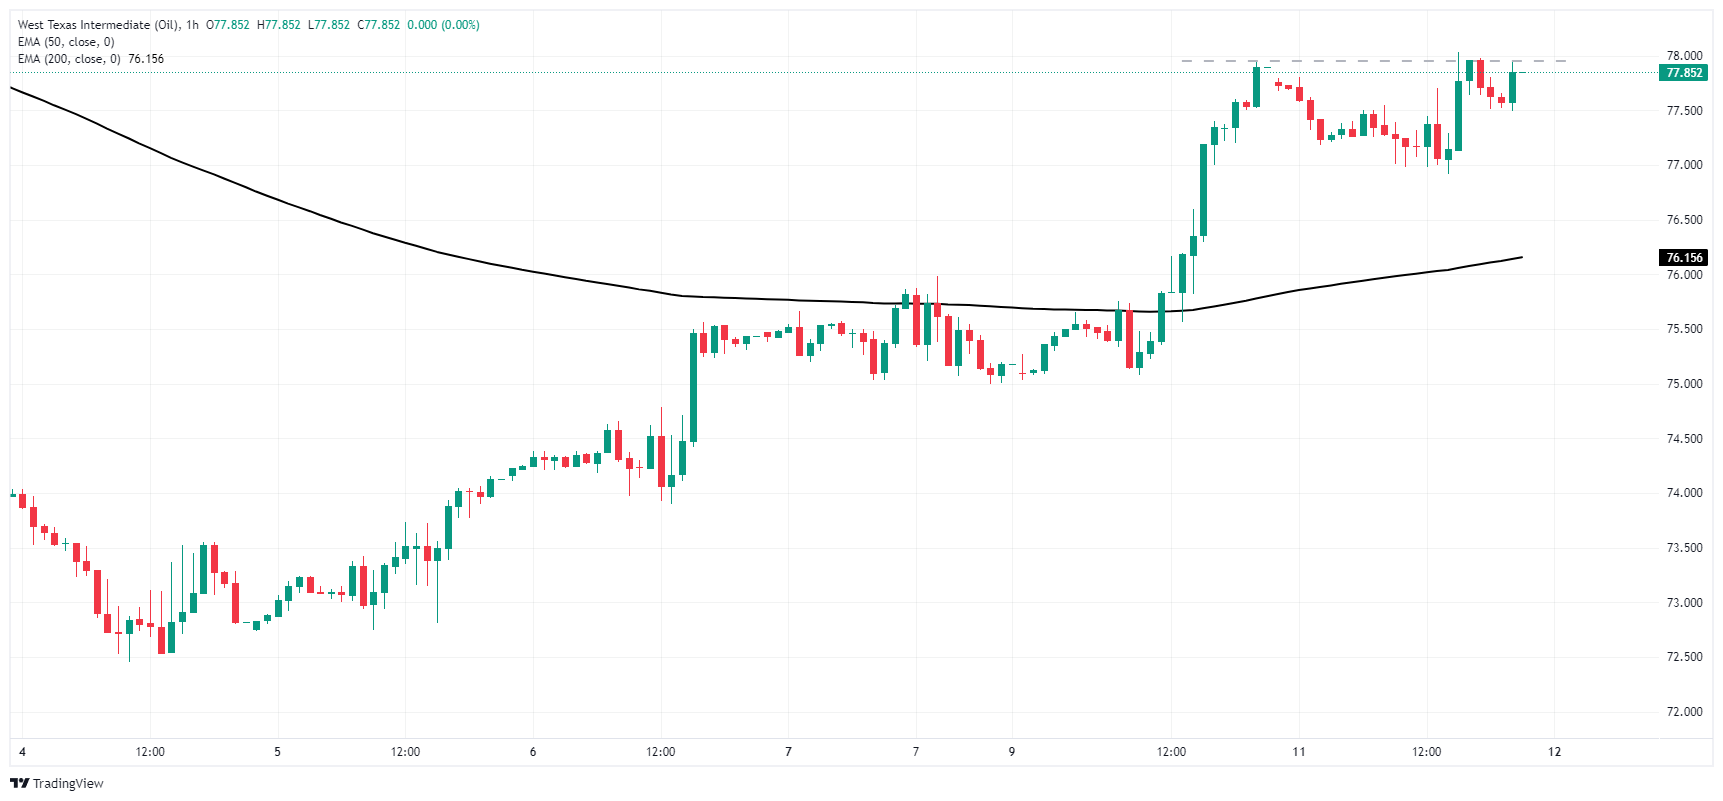
WTI daily chart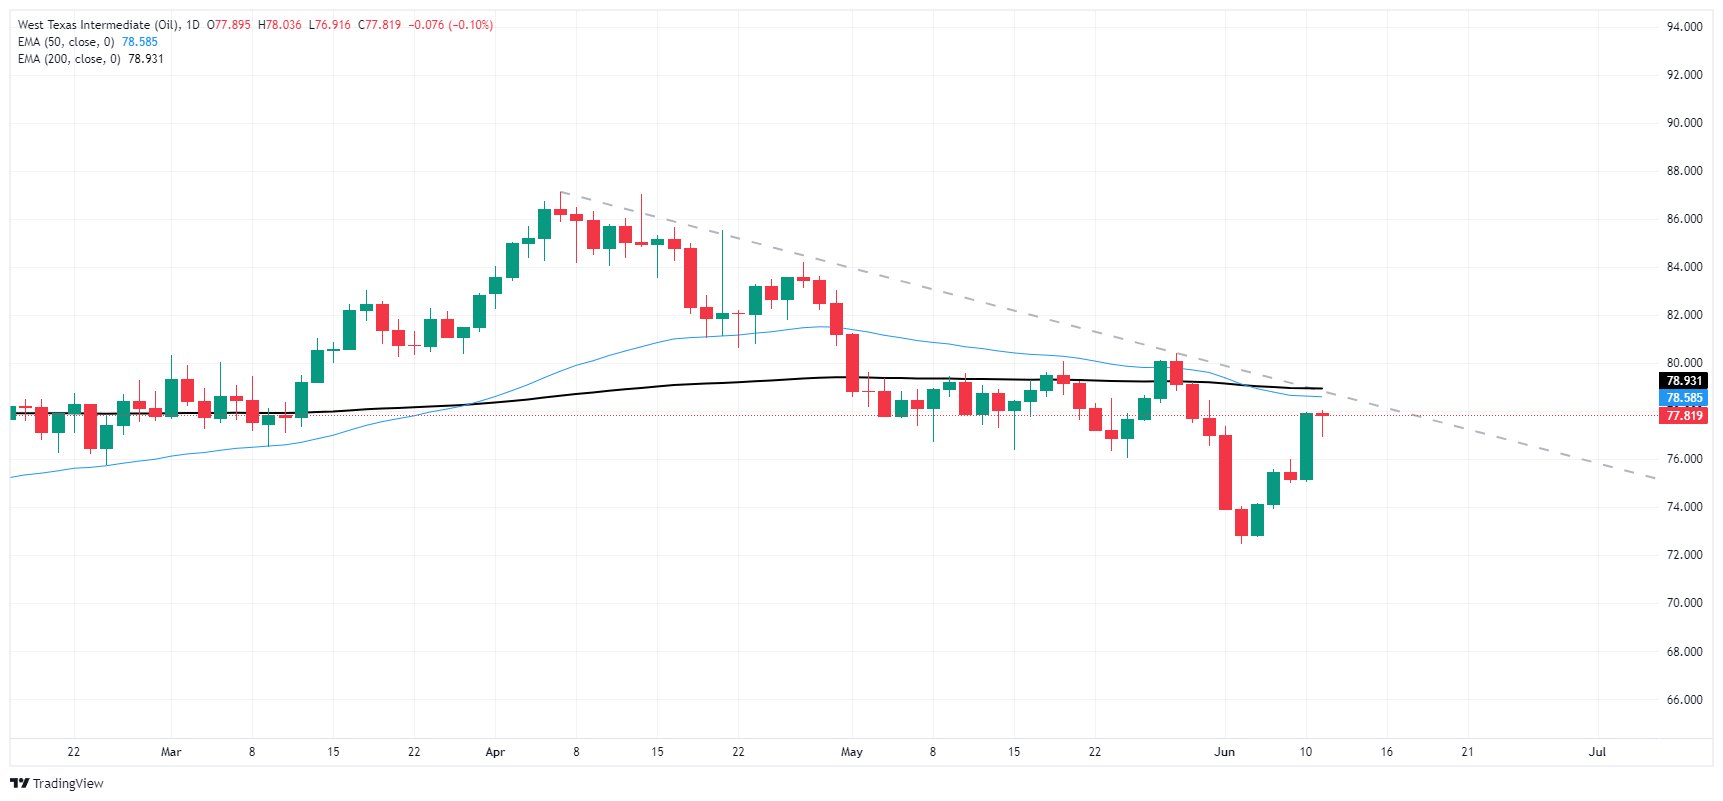


© 2000-2026. Bản quyền Teletrade.
Trang web này được quản lý bởi Teletrade D.J. LLC 2351 LLC 2022 (Euro House, Richmond Hill Road, Kingstown, VC0100, St. Vincent and the Grenadines).
Thông tin trên trang web không phải là cơ sở để đưa ra quyết định đầu tư và chỉ được cung cấp cho mục đích làm quen.
Giao dịch trên thị trường tài chính (đặc biệt là giao dịch sử dụng các công cụ biên) mở ra những cơ hội lớn và tạo điều kiện cho các nhà đầu tư sẵn sàng mạo hiểm để thu lợi nhuận, tuy nhiên nó mang trong mình nguy cơ rủi ro khá cao. Chính vì vậy trước khi tiến hành giao dịch cần phải xem xét mọi mặt vấn đề chấp nhận tiến hành giao dịch cụ thể xét theo quan điểm của nguồn lực tài chính sẵn có và mức độ am hiểu thị trường tài chính.
Sử dụng thông tin: sử dụng toàn bộ hay riêng biệt các dữ liệu trên trang web của công ty TeleTrade như một nguồn cung cấp thông tin nhất định. Việc sử dụng tư liệu từ trang web cần kèm theo liên kết đến trang teletrade.vn. Việc tự động thu thập số liệu cũng như thông tin từ trang web TeleTrade đều không được phép.
Xin vui lòng liên hệ với pr@teletrade.global nếu có câu hỏi.
ngân hàng