- Phân tích
- Tin tức và các công cụ
- Tin tức thị trường
- EUR/JPY Price Analysis: Pair stands neutral, 20-day SMA stands as a strong resistance
EUR/JPY Price Analysis: Pair stands neutral, 20-day SMA stands as a strong resistance
- The daily MACD and RSI indicate decreased bearish momentum.
- A notable support threshold is holding up at 168.00, with recovery levels eyed at 169.70, around the 20-day SMA.
- Despite recent downturns, the broader bullish outlook remains sustained by the 100 and 200-day SMAs.
On Tuesday, the EUR/JPY pair continued to float around the 168.00 level, moving minorly negative as the pair continued sideways trading. Any potential recovery falls at the hands of the 20-day Simple Moving Average (SMA) which is currently near the 169.70 mark, which acts as an upper boundary hurdle.
The daily Relative Strength Index (RSI) has nudged lower towards 50 maintaining a bearish aura. This, coupled with the continuing display of flat red MACD bars, construes potentially consolidative behavior amidst the ongoing neutral landscape. Hence, the market appears to be in a holding pattern pending a significant driver for more substantial moves.
EUR/JPY daily chart
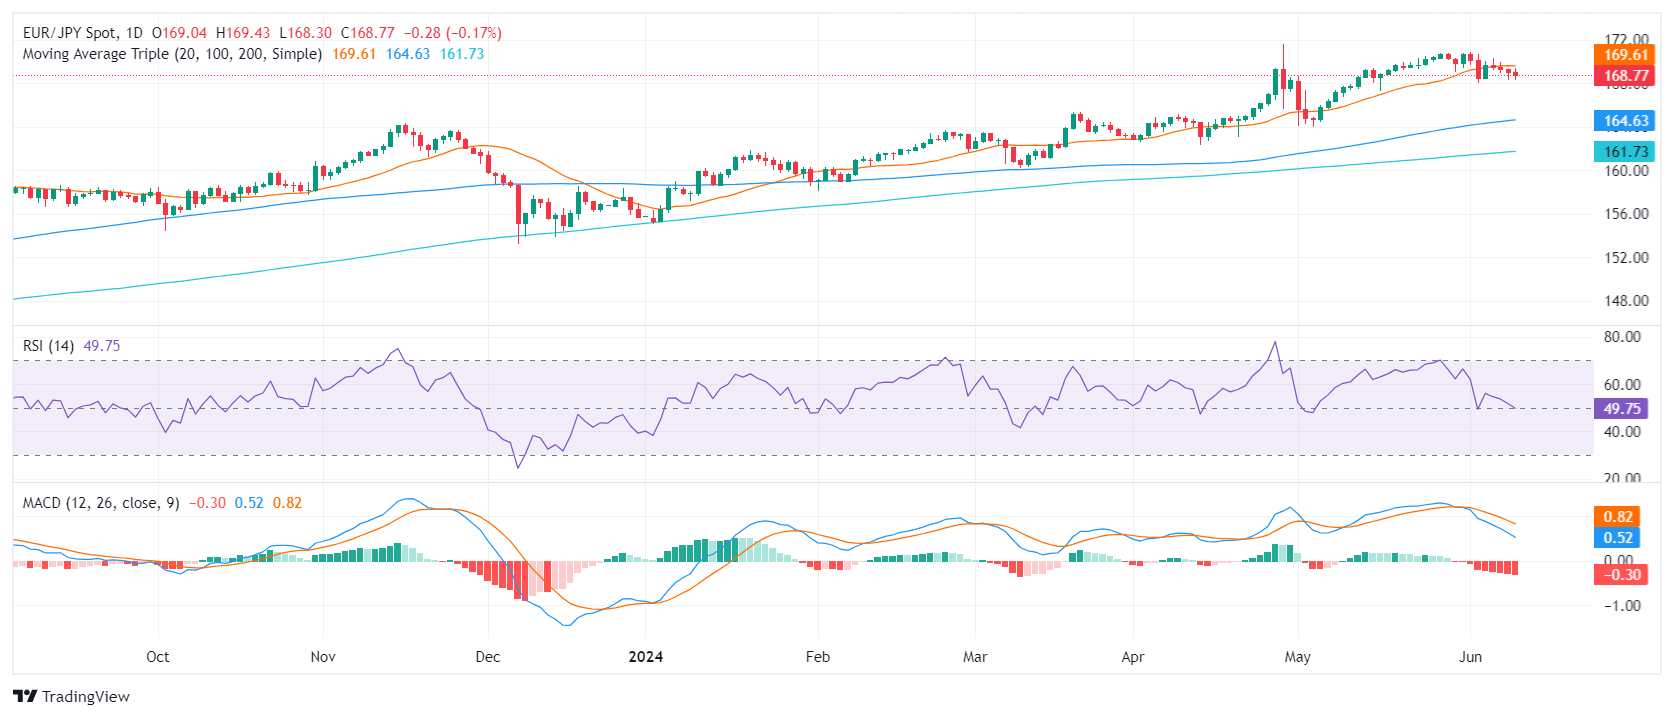
That being said, the overarching bullish forces remain at play. The fundamental stronghold arises from the 100 and 200-day SMAs present at approximately 164.00 and 161.00, which might provide defense against potential losses.
To conclude, traders remain focused on the movements around the 168.00 support level and the 169.70 recovery hurdle. A breach either way may decide the direction of the upcoming sessions.


© 2000-2026. Bản quyền Teletrade.
Trang web này được quản lý bởi Teletrade D.J. LLC 2351 LLC 2022 (Euro House, Richmond Hill Road, Kingstown, VC0100, St. Vincent and the Grenadines).
Thông tin trên trang web không phải là cơ sở để đưa ra quyết định đầu tư và chỉ được cung cấp cho mục đích làm quen.
Giao dịch trên thị trường tài chính (đặc biệt là giao dịch sử dụng các công cụ biên) mở ra những cơ hội lớn và tạo điều kiện cho các nhà đầu tư sẵn sàng mạo hiểm để thu lợi nhuận, tuy nhiên nó mang trong mình nguy cơ rủi ro khá cao. Chính vì vậy trước khi tiến hành giao dịch cần phải xem xét mọi mặt vấn đề chấp nhận tiến hành giao dịch cụ thể xét theo quan điểm của nguồn lực tài chính sẵn có và mức độ am hiểu thị trường tài chính.
Sử dụng thông tin: sử dụng toàn bộ hay riêng biệt các dữ liệu trên trang web của công ty TeleTrade như một nguồn cung cấp thông tin nhất định. Việc sử dụng tư liệu từ trang web cần kèm theo liên kết đến trang teletrade.vn. Việc tự động thu thập số liệu cũng như thông tin từ trang web TeleTrade đều không được phép.
Xin vui lòng liên hệ với pr@teletrade.global nếu có câu hỏi.
ngân hàng