- Phân tích
- Tin tức và các công cụ
- Tin tức thị trường
- EUR/JPY Price Analysis: Support holds strong at 168.00 and clears losses
EUR/JPY Price Analysis: Support holds strong at 168.00 and clears losses
- The daily RSI remains settled in the negative territory, with the daily MACD displaying flat red bars reflecting stable bearish momentum.
- The pair finds steady support near 168.00, stabilizing at 168.80 beyond the session's low at 168.15.
- The prevalent bullish trend is sustained by the fortitude of the 100- and 200-day SMAs.
On Monday, the EUR/JPY pair experienced an initial fall to 168.15 before stabilizing at 168.80, which seems to affirm the fortification of the support level around 168.00. Although an effort to recover the short-term 20-day SMA is needed to avert further descent, the 168.00 barrier would likely act as a fallback for the bulls if market pressure intensifies.
The Relative Strength Index (RSI) on the daily chart now reads 47, preserving its position in the negative area, which implies a slightly bearish market disposition. The daily Moving Average Convergence Divergence (MACD) retains flat red bars, marking a steady bearish momentum. This could perhaps signal a consolidation phase prior to any substantial shifts.
EUR/JPY daily chart
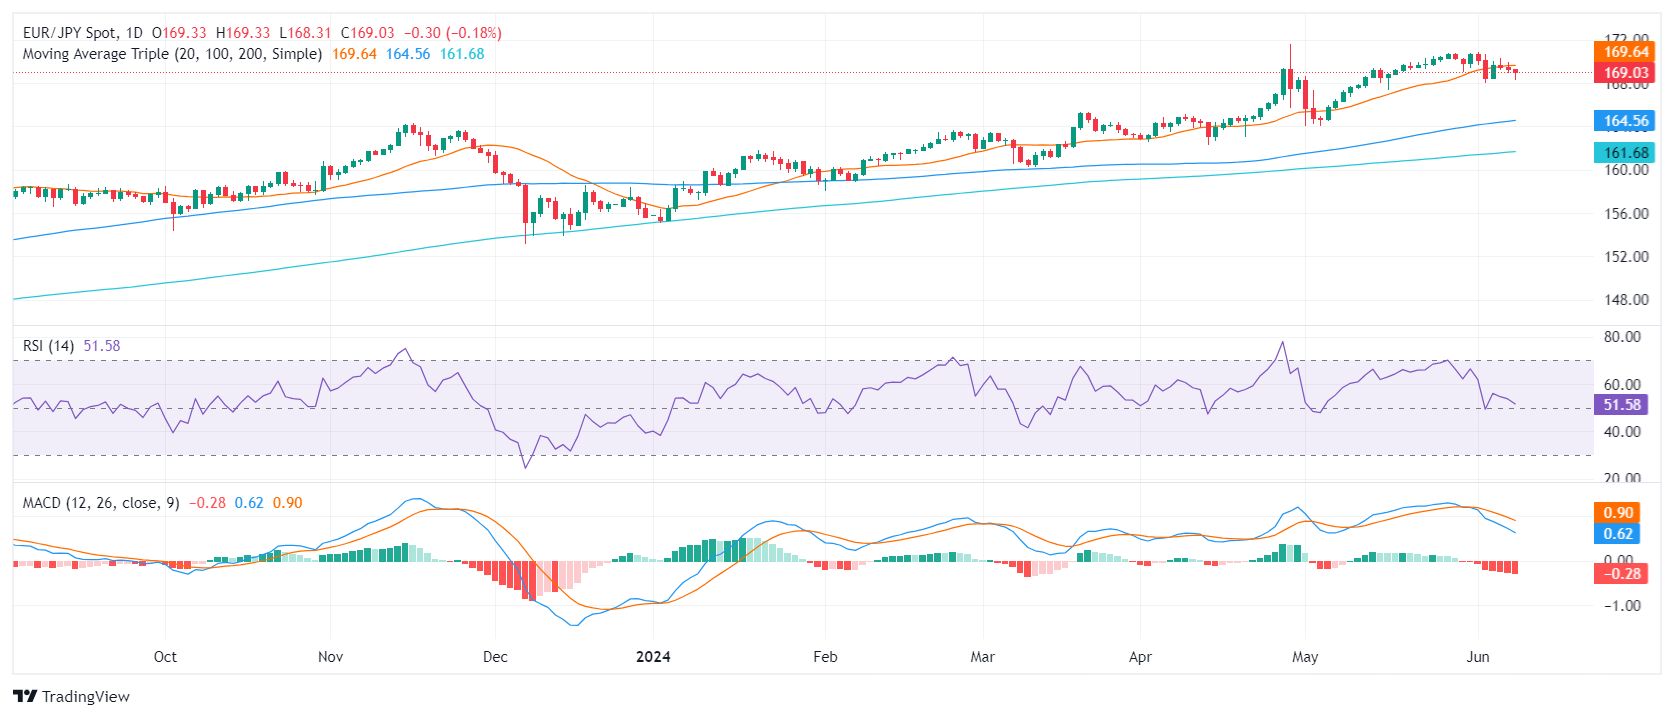
On the other hand, the broader bullish tendency in the EUR/JPY persists. The robust support rendered by the 100- and 200-day Simple Moving Averages (SMAs), located around 164.00 and 161.00 correspondingly, remains a strong fortification against extensive bearish movements. Hence, despite the mild bearish undertones of recent sessions, these fluctuations are possibly corrective rather than indicative of any sweeping alterations in the prevailing trend.


© 2000-2026. Bản quyền Teletrade.
Trang web này được quản lý bởi Teletrade D.J. LLC 2351 LLC 2022 (Euro House, Richmond Hill Road, Kingstown, VC0100, St. Vincent and the Grenadines).
Thông tin trên trang web không phải là cơ sở để đưa ra quyết định đầu tư và chỉ được cung cấp cho mục đích làm quen.
Giao dịch trên thị trường tài chính (đặc biệt là giao dịch sử dụng các công cụ biên) mở ra những cơ hội lớn và tạo điều kiện cho các nhà đầu tư sẵn sàng mạo hiểm để thu lợi nhuận, tuy nhiên nó mang trong mình nguy cơ rủi ro khá cao. Chính vì vậy trước khi tiến hành giao dịch cần phải xem xét mọi mặt vấn đề chấp nhận tiến hành giao dịch cụ thể xét theo quan điểm của nguồn lực tài chính sẵn có và mức độ am hiểu thị trường tài chính.
Sử dụng thông tin: sử dụng toàn bộ hay riêng biệt các dữ liệu trên trang web của công ty TeleTrade như một nguồn cung cấp thông tin nhất định. Việc sử dụng tư liệu từ trang web cần kèm theo liên kết đến trang teletrade.vn. Việc tự động thu thập số liệu cũng như thông tin từ trang web TeleTrade đều không được phép.
Xin vui lòng liên hệ với pr@teletrade.global nếu có câu hỏi.
ngân hàng