- Phân tích
- Tin tức và các công cụ
- Tin tức thị trường
- GBP/USD Price Analysis: Consolidates around 1.2700 after hitting 7-day low
GBP/USD Price Analysis: Consolidates around 1.2700 after hitting 7-day low
- GBP/USD slightly down for the second session in a row.
- Technicals indicate losing buyer momentum as RSI approaches the 50-midline.
- A drop below 1.2700 could push GBP/USD towards key moving averages near 1.2686 and potentially lower.
- Upside seen above 1.2750, with buyers eyeing 1.2800.
The British Pound extended its losses for the second consecutive trading session against the US Dollar, following last Friday’s stellar jobs report from the US, which triggered the likelihood of a less dovish Federal Reserve. That and uncertainty on the upcoming Fed’s meeting would keep Cable pressured. Therefore, the GBP/USD trades at 1.2713, down 0.01%
GBP/USD Price Analysis: Technical outlook
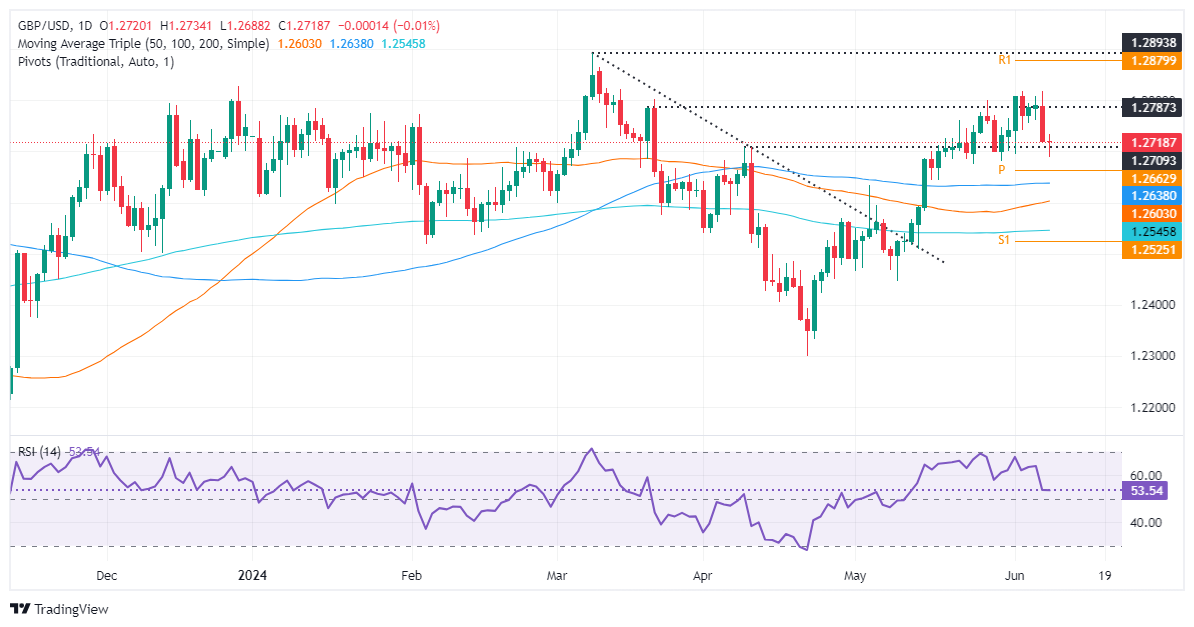
After struggling at around 1.2800 with key technical resistance levels, the GBP/USD tumbled below 1.2700 and printed a new seven-day low of 1.2687 before recovering some ground.
Although momentum still favors buyers, the Relative Strength Index (RSI) dropped sharply towards crossing the 50-midline, hinting that buyers are losing momentum. Nevertheless, Monday’s price action seems to form a ‘dragonfly doji,’ a bullish candlestick.
If GBP/USD reclaims 1.2750, it will be possible to challenge the June 7 high of 1.2813. Once cleared, the next resistance line will be 1.2850, followed by 1.2900.
Conversely, if GBP/USD prints a daily close below 1.2700, that would sponsor a leg-down toward the confluence of the 100-day moving average (DMA) at around 1.2686, ahead of the 50 and 200-DMAs each at 1.2602 and 1.2543, respectively.
GBP/USD Price Action – Daily Chart


© 2000-2026. Bản quyền Teletrade.
Trang web này được quản lý bởi Teletrade D.J. LLC 2351 LLC 2022 (Euro House, Richmond Hill Road, Kingstown, VC0100, St. Vincent and the Grenadines).
Thông tin trên trang web không phải là cơ sở để đưa ra quyết định đầu tư và chỉ được cung cấp cho mục đích làm quen.
Giao dịch trên thị trường tài chính (đặc biệt là giao dịch sử dụng các công cụ biên) mở ra những cơ hội lớn và tạo điều kiện cho các nhà đầu tư sẵn sàng mạo hiểm để thu lợi nhuận, tuy nhiên nó mang trong mình nguy cơ rủi ro khá cao. Chính vì vậy trước khi tiến hành giao dịch cần phải xem xét mọi mặt vấn đề chấp nhận tiến hành giao dịch cụ thể xét theo quan điểm của nguồn lực tài chính sẵn có và mức độ am hiểu thị trường tài chính.
Sử dụng thông tin: sử dụng toàn bộ hay riêng biệt các dữ liệu trên trang web của công ty TeleTrade như một nguồn cung cấp thông tin nhất định. Việc sử dụng tư liệu từ trang web cần kèm theo liên kết đến trang teletrade.vn. Việc tự động thu thập số liệu cũng như thông tin từ trang web TeleTrade đều không được phép.
Xin vui lòng liên hệ với pr@teletrade.global nếu có câu hỏi.
ngân hàng