- Phân tích
- Tin tức và các công cụ
- Tin tức thị trường
- GBP/USD Price Analysis: The potential support level is located above 1.2700
GBP/USD Price Analysis: The potential support level is located above 1.2700
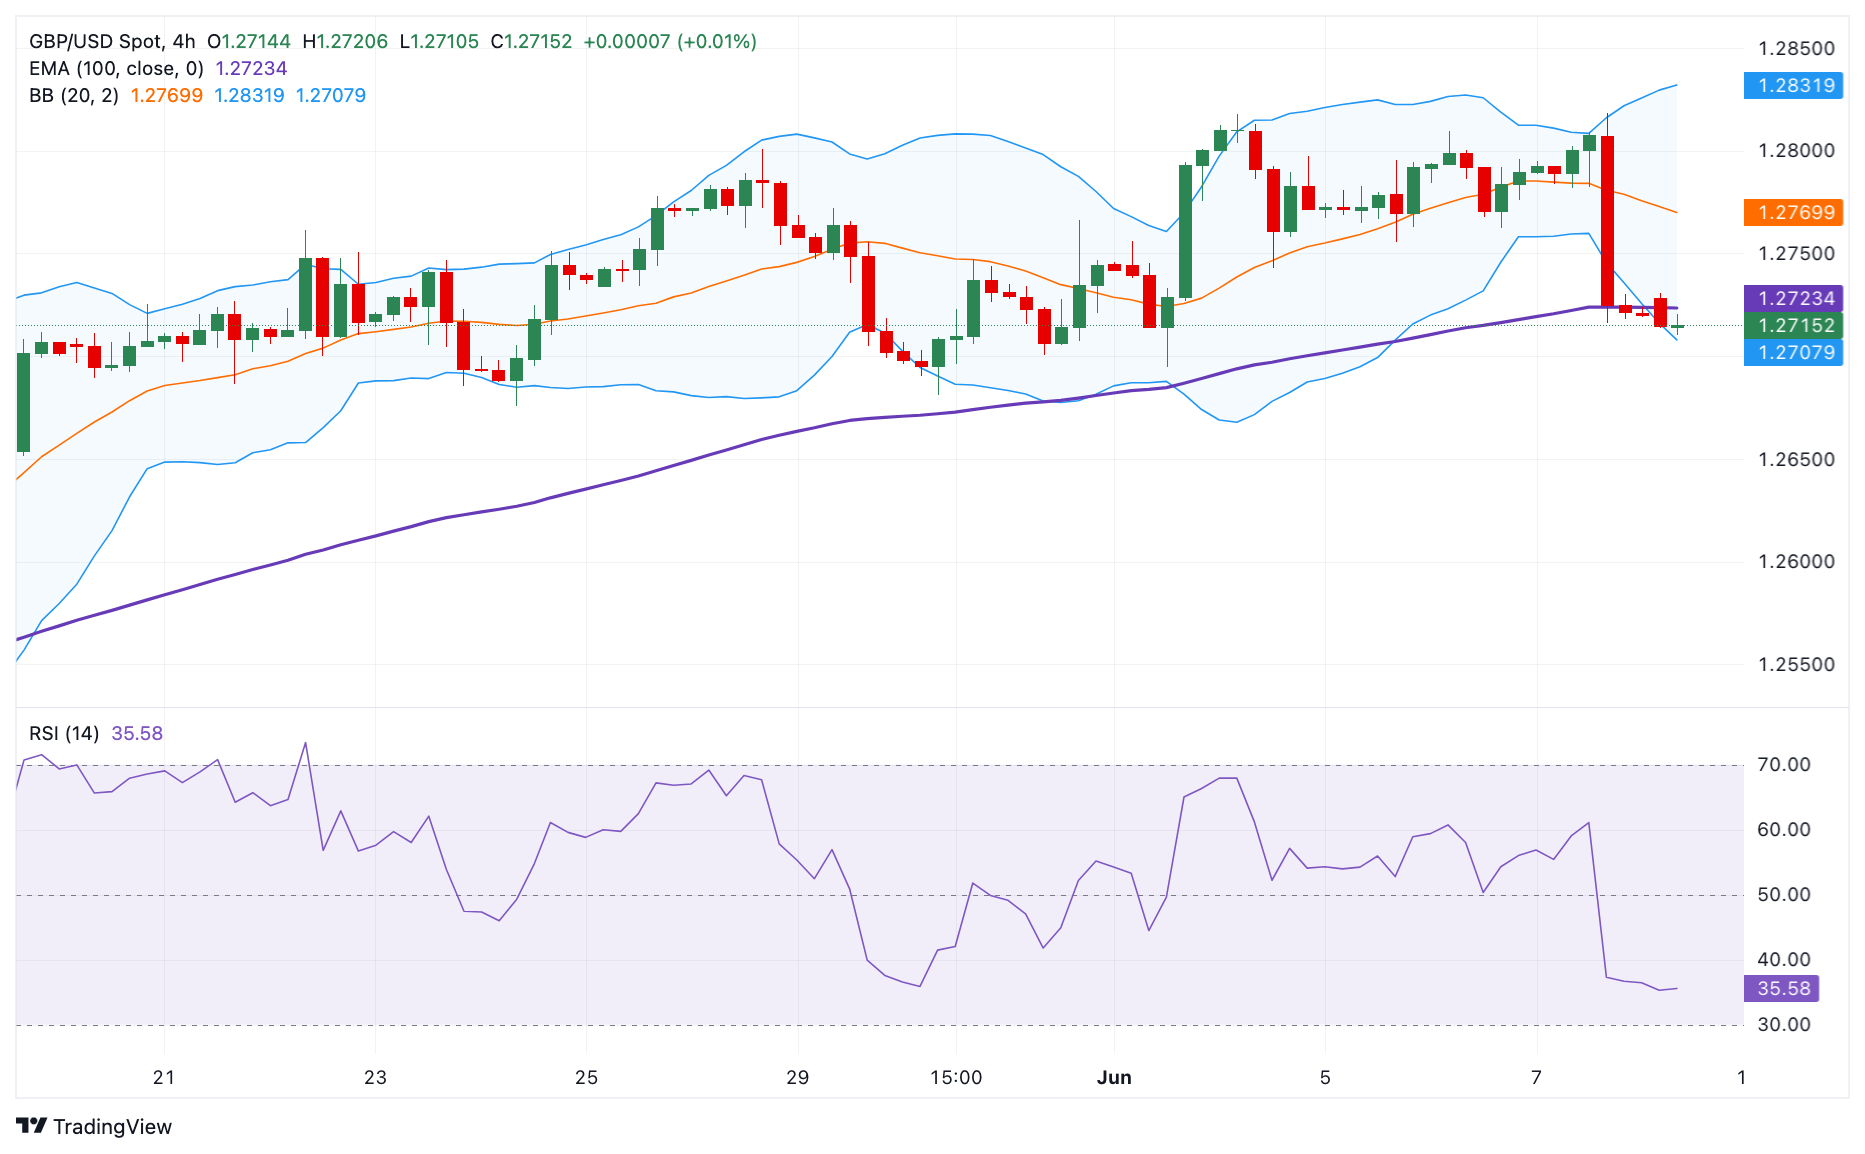
- GBP/USD struggles to gain ground around 1.2715 in Monday’s early European session.
- The pair keeps the negative vibe below the 100-period EMA, with bearish RSI indicator on the 4-hour chart.
- The first downside target is seen in the 1.2700–1.2701 zone; the next upside barrier is located at 1.2795.
The GBP/USD pair trades in negative territory for the second consecutive day near 1.2715 during the early European session on Monday. The stronger US Dollar (USD) broadly drags the major pair lower. Investors await the UK Employment data on Tuesday for fresh impetus, including Claimant Count Change, Employment Change, and Average Earnings data. Any evidence of more layoffs in the UK economy might trigger the expectations of early rate cuts from the Bank of England (BoE) and might weigh on the Pound Sterling (GBP).
According to the 4-hour chart, the outlook of GBP/USD turns bearish as it holds below the key 100-period Exponential Moving Average (EMA). The downward momentum is supported by the Relative Strength Index (RSI), which stands around 37.00, indicating the path of least resistance is to the downside.
A decisive break below the lower limit of the Bollinger Band and psychological level at the 1.2700-1.2710 region will pave the way to 1.2681, a low of May 30. Further south, the next contention level is seen at 1.2645, a low of May 17, followed by the 1.2600 round mark.
The major pair should resume the upside if it crosses above the 100-period EMA at 1.2723. The next upside barrier for GBP/USD will emerge at 1.2795, a low of June 5. Any follow-through buying will expose 1.2809, a high of June 6, and finally the upper boundary of the Bollinger Band at 1.2831.
GBP/USD 4-hour chart


© 2000-2026. Bản quyền Teletrade.
Trang web này được quản lý bởi Teletrade D.J. LLC 2351 LLC 2022 (Euro House, Richmond Hill Road, Kingstown, VC0100, St. Vincent and the Grenadines).
Thông tin trên trang web không phải là cơ sở để đưa ra quyết định đầu tư và chỉ được cung cấp cho mục đích làm quen.
Giao dịch trên thị trường tài chính (đặc biệt là giao dịch sử dụng các công cụ biên) mở ra những cơ hội lớn và tạo điều kiện cho các nhà đầu tư sẵn sàng mạo hiểm để thu lợi nhuận, tuy nhiên nó mang trong mình nguy cơ rủi ro khá cao. Chính vì vậy trước khi tiến hành giao dịch cần phải xem xét mọi mặt vấn đề chấp nhận tiến hành giao dịch cụ thể xét theo quan điểm của nguồn lực tài chính sẵn có và mức độ am hiểu thị trường tài chính.
Sử dụng thông tin: sử dụng toàn bộ hay riêng biệt các dữ liệu trên trang web của công ty TeleTrade như một nguồn cung cấp thông tin nhất định. Việc sử dụng tư liệu từ trang web cần kèm theo liên kết đến trang teletrade.vn. Việc tự động thu thập số liệu cũng như thông tin từ trang web TeleTrade đều không được phép.
Xin vui lòng liên hệ với pr@teletrade.global nếu có câu hỏi.
ngân hàng