- Phân tích
- Tin tức và các công cụ
- Tin tức thị trường
- EUR/JPY Price Analysis: Bulls fight to hold the 20-day SMA, bears steady
EUR/JPY Price Analysis: Bulls fight to hold the 20-day SMA, bears steady
- The daily RSI records a balanced reading at 50, while the MACD bears a bearish crossover.
- The pair stabilize near the 20-day SMA, with buyers trying to avoid losses beneath it.
- The underlying bullish trend remains intact, guarded by the 100- and 200-day SMAs.
In Friday's session, the EUR/JPY pair is seen consolidating after a significant upward wave which took it near multi-year highs around 171.00, oscillating around the crucial 169.00 level. The stabilization at this junction is particularly corroborated by the proximity to the 20-day Simple Moving Average (SMA) near 169.60 which despite falling beneath, the cross will try to defend it as it serves as a strong support.
The Relative Strength Index (RSI) on the daily chart reads a steady 53 now, reflecting balanced market sentiment between the buyers and the sellers. This neutral RSI implies that the market participants are currently eagle-eyeing further direction before making a move. The daily Moving Average Convergence Divergence (MACD) has recently registered a bearish crossover- an occurrence when the MACD line dived under the signal line. This crossover potentially signals ensuing short-term bearish pressure, opening up possibilities of a tempo correction or further consolidation before resuming the upward march.
EUR/JPY daily chart
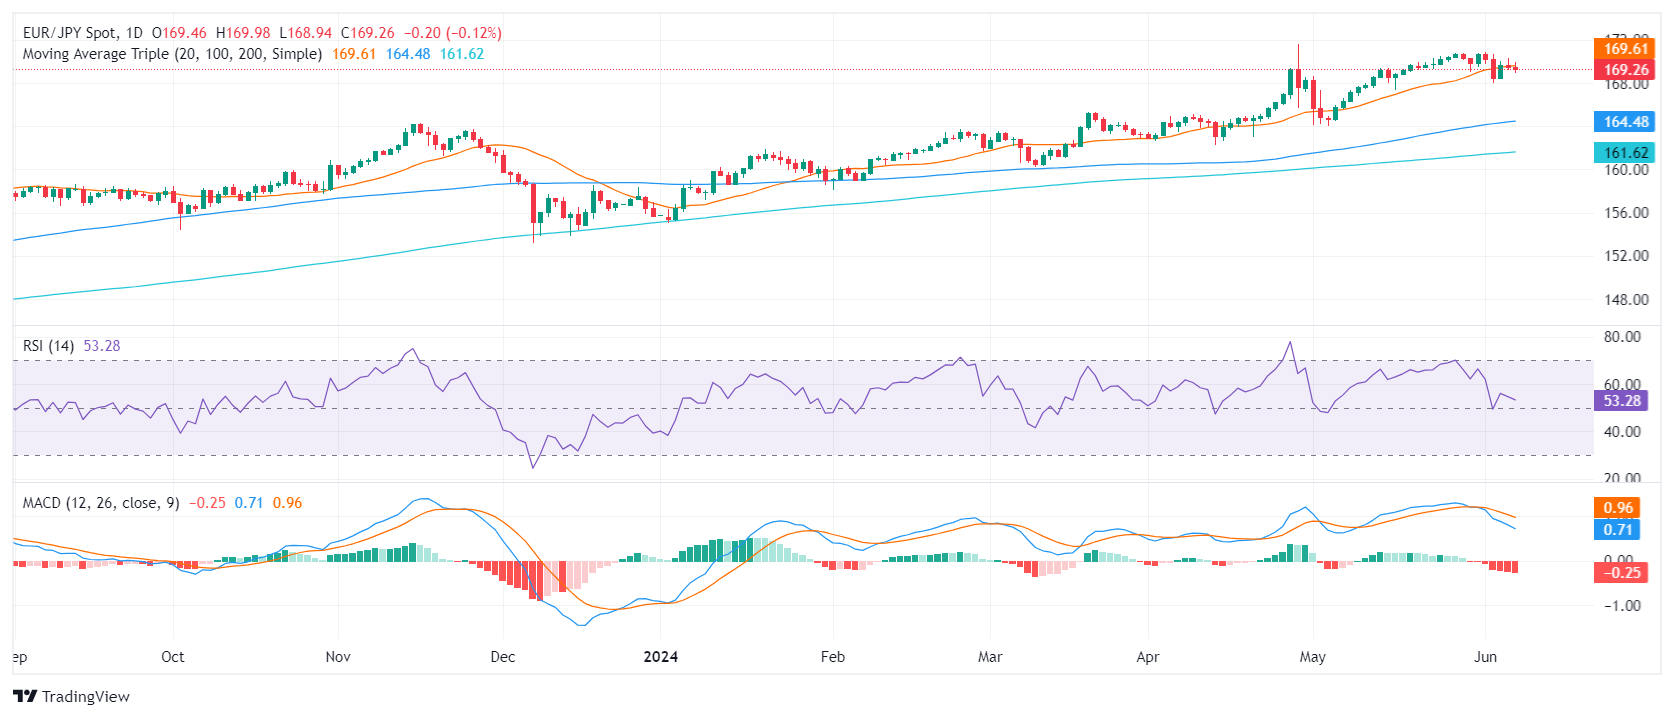
However, the broader bullish trend in the EUR/JPY remains unaffected. The support formed by the 100- and 200-day Simple Moving Averages (SMAs) at around 164.00 and 161.00, respectively, form a major bastion against long-drawn bearish movements. Therefore, while recent sessions brought some hope to bear, these movements should be treated as corrective rather than any structural changes in the trend.


© 2000-2026. Bản quyền Teletrade.
Trang web này được quản lý bởi Teletrade D.J. LLC 2351 LLC 2022 (Euro House, Richmond Hill Road, Kingstown, VC0100, St. Vincent and the Grenadines).
Thông tin trên trang web không phải là cơ sở để đưa ra quyết định đầu tư và chỉ được cung cấp cho mục đích làm quen.
Giao dịch trên thị trường tài chính (đặc biệt là giao dịch sử dụng các công cụ biên) mở ra những cơ hội lớn và tạo điều kiện cho các nhà đầu tư sẵn sàng mạo hiểm để thu lợi nhuận, tuy nhiên nó mang trong mình nguy cơ rủi ro khá cao. Chính vì vậy trước khi tiến hành giao dịch cần phải xem xét mọi mặt vấn đề chấp nhận tiến hành giao dịch cụ thể xét theo quan điểm của nguồn lực tài chính sẵn có và mức độ am hiểu thị trường tài chính.
Sử dụng thông tin: sử dụng toàn bộ hay riêng biệt các dữ liệu trên trang web của công ty TeleTrade như một nguồn cung cấp thông tin nhất định. Việc sử dụng tư liệu từ trang web cần kèm theo liên kết đến trang teletrade.vn. Việc tự động thu thập số liệu cũng như thông tin từ trang web TeleTrade đều không được phép.
Xin vui lòng liên hệ với pr@teletrade.global nếu có câu hỏi.
ngân hàng