- Phân tích
- Tin tức và các công cụ
- Tin tức thị trường
- Oil Price Analysis: Short-term downtrend unfolds within falling channel
Oil Price Analysis: Short-term downtrend unfolds within falling channel
- WTI Oil is unfolding an up leg within a falling channel.
- It is close to meeting resistance from the upper channel boundary line and the 50 SMA.
- A reversal at this point would probably lead to an extension of the downtrend and the falling channel.
WTI Oil price (OIL) has been trending lower in a channel since the beginning of April. It is in a downtrend on the 4-hour Chart which is used to analyze the short-term trend (up to 6 weeks). Given that “the trend is your friend” this is expected to continue.
More recently, WTI Oil has started a counter-trend recovery rally back up within the falling channel and is now approaching the upper (green) boundary line at roughly $76.20. The 50 Simple Moving Average (SMA) is situated nearby at $76.33. These are likely to present tough obstacles to bulls. Assuming the channel keeps its integrity they may trigger a reversal back down within the channel.
WTI Oil 4-hour Chart
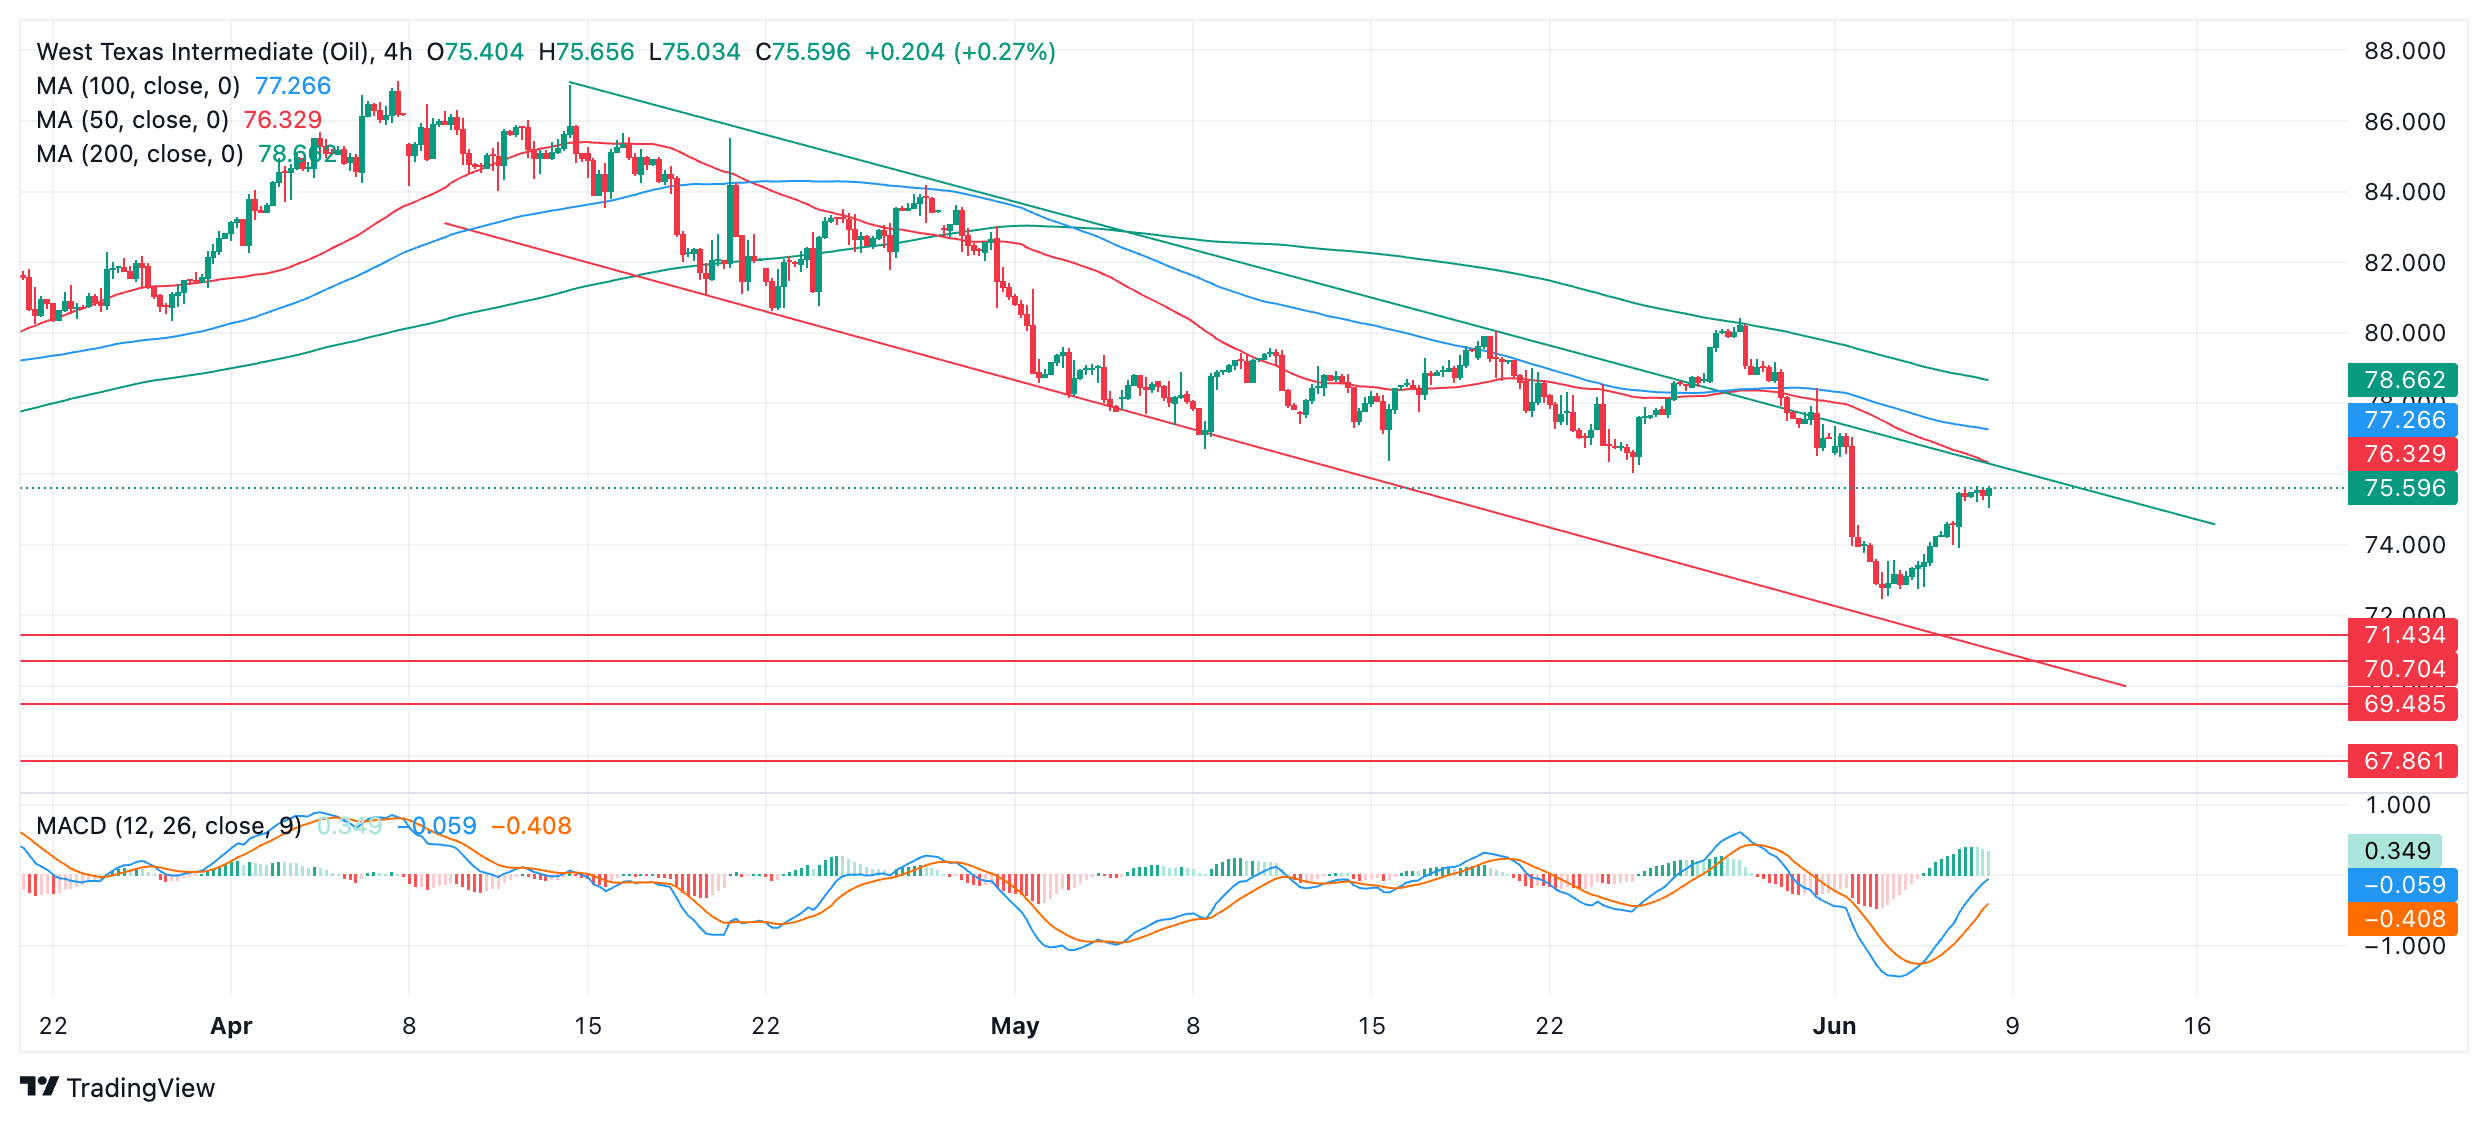
The Moving Average Convergence Divergence (MACD) indicator is in negative territory but rising, it suggests a little more upside is probably on the horizon before the next turn – probably to the aforementioned green channel line.
Key reversals in price as it moves up and down within the channel have corresponded quite reliably with the MACD crossing above and below its red signal line. If the synchronicity continues, it suggests that if price rises up to resistance from the upper channel line and then reverses down, it will be accompanied by a corresponding cross of the MACD below its signal line. Such a cross would provide supporting evidence to back up the idea of a reversal lower in line with the dominant downtrend, especially if it occurs when the MACD is above zero. A bearish candlestick reversal pattern or other similar reversal insignia would also add evidence.
If this scenario plays out, the next down leg of the channel could reach $72.46 (June 4 low) initially, followed by $71.43 (February 5 low) and then $70.70 (January 17 low).
The break above the channel line that occurred during the rally between May 24-29 was a bullish sign, however, and suggests an increased risk price could break above again.


© 2000-2026. Bản quyền Teletrade.
Trang web này được quản lý bởi Teletrade D.J. LLC 2351 LLC 2022 (Euro House, Richmond Hill Road, Kingstown, VC0100, St. Vincent and the Grenadines).
Thông tin trên trang web không phải là cơ sở để đưa ra quyết định đầu tư và chỉ được cung cấp cho mục đích làm quen.
Giao dịch trên thị trường tài chính (đặc biệt là giao dịch sử dụng các công cụ biên) mở ra những cơ hội lớn và tạo điều kiện cho các nhà đầu tư sẵn sàng mạo hiểm để thu lợi nhuận, tuy nhiên nó mang trong mình nguy cơ rủi ro khá cao. Chính vì vậy trước khi tiến hành giao dịch cần phải xem xét mọi mặt vấn đề chấp nhận tiến hành giao dịch cụ thể xét theo quan điểm của nguồn lực tài chính sẵn có và mức độ am hiểu thị trường tài chính.
Sử dụng thông tin: sử dụng toàn bộ hay riêng biệt các dữ liệu trên trang web của công ty TeleTrade như một nguồn cung cấp thông tin nhất định. Việc sử dụng tư liệu từ trang web cần kèm theo liên kết đến trang teletrade.vn. Việc tự động thu thập số liệu cũng như thông tin từ trang web TeleTrade đều không được phép.
Xin vui lòng liên hệ với pr@teletrade.global nếu có câu hỏi.
ngân hàng