- Phân tích
- Tin tức và các công cụ
- Tin tức thị trường
- NZD/JPY Price Analysis: Kiwi rebounds from 20-day SMA, yet consolidation looms
NZD/JPY Price Analysis: Kiwi rebounds from 20-day SMA, yet consolidation looms
- The Kiwi retakes control against the Yen on Wednesday, bouncing off the 20-day SMA and surging towards 96.75.
- Despite the buyers' push, the pair is likely bound to a consolidation period.
- The established fortification around the 20-day SMA serves as a guard against further declines.
On Wednesday, the NZD/JPY pair saw a formidable rebound from the 20-day Simple Moving Average (SMA) at 95.50, launching upward towards 96.75. But despite the buyers' effort, it appears that the pair is firmly locked within a consolidation phase, limiting the chances of a quick overrunning of the multi-year high at around 97.00.
The Relative Strength Index (RSI) on the daily chart, currently at 64, has navigated upward from Tuesday's modest reading of 54, indicating a positive momentum shift. Now residing comfortably in the positive territory, this demonstrates an uptick in buying pressure. Meanwhile, the Moving Average Convergence Divergence (MACD) continues to print flat red bars, suggesting moderating selling momentum and reinforcing the likelihood of a continuation of the consolidation period rather than a full reversal.
NZD/JPY daily chart
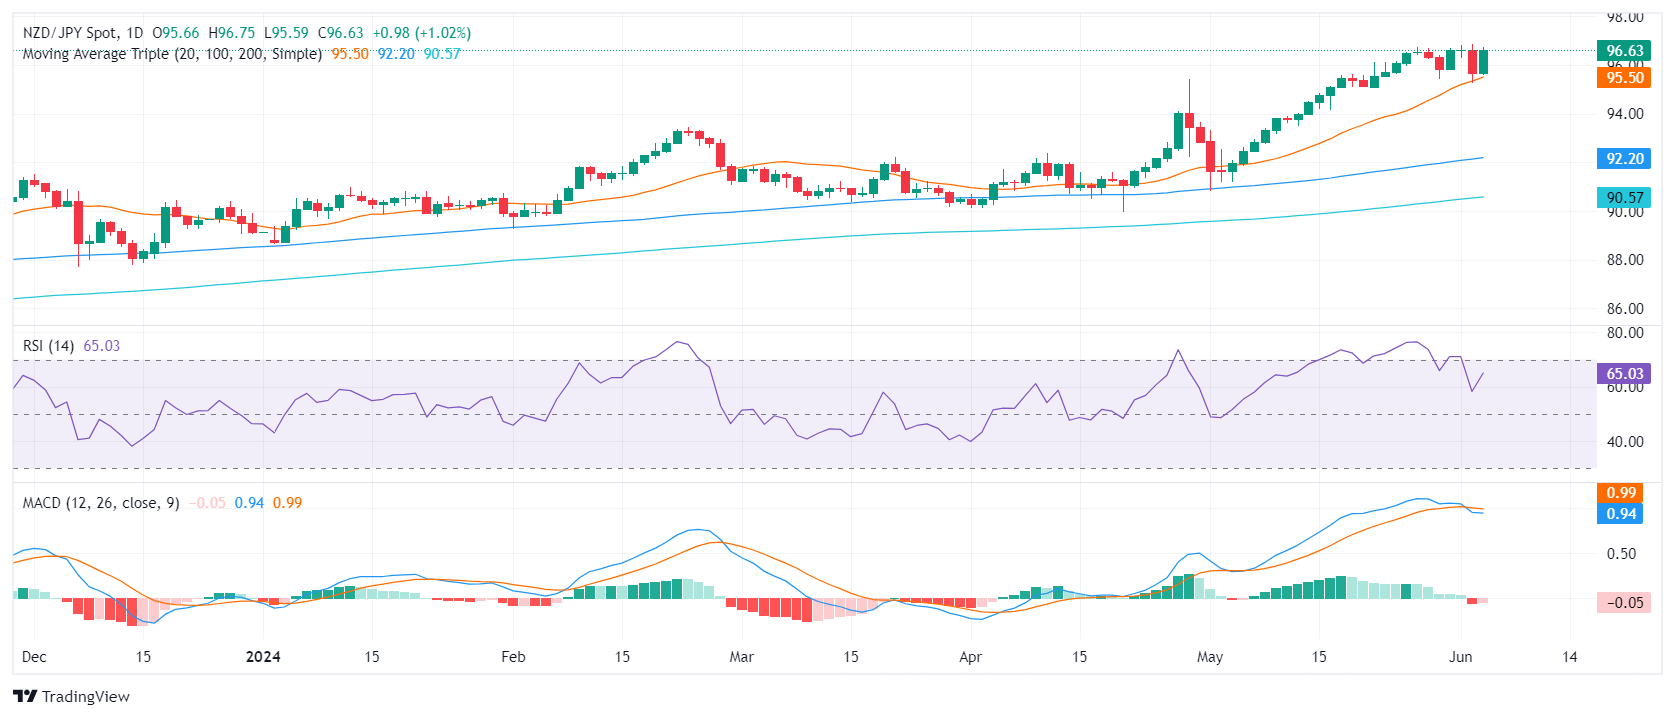
While buyers displayed renewed energy, the consolidation phase established after the impressive sprint from near 91.00 to 96.00 in May seems to hold sway. This likely indicates that the bullish contingent may need a breather before mounting further upward movements.
For buyers to reaffirm their hold, they would need to overcome the 97.00 resistance, opening the gates for another ascension towards new highs. However, until such a rally materializes, the pair may continue to tread water as it digests the recent spike in buying pressure.


© 2000-2026. Bản quyền Teletrade.
Trang web này được quản lý bởi Teletrade D.J. LLC 2351 LLC 2022 (Euro House, Richmond Hill Road, Kingstown, VC0100, St. Vincent and the Grenadines).
Thông tin trên trang web không phải là cơ sở để đưa ra quyết định đầu tư và chỉ được cung cấp cho mục đích làm quen.
Giao dịch trên thị trường tài chính (đặc biệt là giao dịch sử dụng các công cụ biên) mở ra những cơ hội lớn và tạo điều kiện cho các nhà đầu tư sẵn sàng mạo hiểm để thu lợi nhuận, tuy nhiên nó mang trong mình nguy cơ rủi ro khá cao. Chính vì vậy trước khi tiến hành giao dịch cần phải xem xét mọi mặt vấn đề chấp nhận tiến hành giao dịch cụ thể xét theo quan điểm của nguồn lực tài chính sẵn có và mức độ am hiểu thị trường tài chính.
Sử dụng thông tin: sử dụng toàn bộ hay riêng biệt các dữ liệu trên trang web của công ty TeleTrade như một nguồn cung cấp thông tin nhất định. Việc sử dụng tư liệu từ trang web cần kèm theo liên kết đến trang teletrade.vn. Việc tự động thu thập số liệu cũng như thông tin từ trang web TeleTrade đều không được phép.
Xin vui lòng liên hệ với pr@teletrade.global nếu có câu hỏi.
ngân hàng