- Phân tích
- Tin tức và các công cụ
- Tin tức thị trường
- EUR/JPY Price Analysis: Momentum shifts, bulls recover 20-day SMA
EUR/JPY Price Analysis: Momentum shifts, bulls recover 20-day SMA
- The daily RSI has shifted its course upwards, backed by the flat red bars on the MACD.
- Buyers stepped in to recover 20-Day SMA, shifting the short-term outlook from bearish to neutral.
- The underlying bullish trend is still safeguarded by the 100 and 200-day SMAs.
In Wednesday's session, the EUR/JPY pair witnessed a shift in momentum as buyers stepped in to recover the 20-day Simple Moving Average (SMA) at 169.40, supported by a recovery in the Yen against its peers. This bullish shift counters the bearish momentum from Tuesday's session as the pair emerges from local lows of 168.50.
The Relative Strength Index (RSI) on the daily chart has shown an upward shift from 48 to 54. This suggests an increase in buying momentum, potentially paving the way for a more substantial upside movement. The flat red bars on the daily Moving Average Convergence Divergence (MACD) further support this improving outlook.
EUR/JPY daily chart
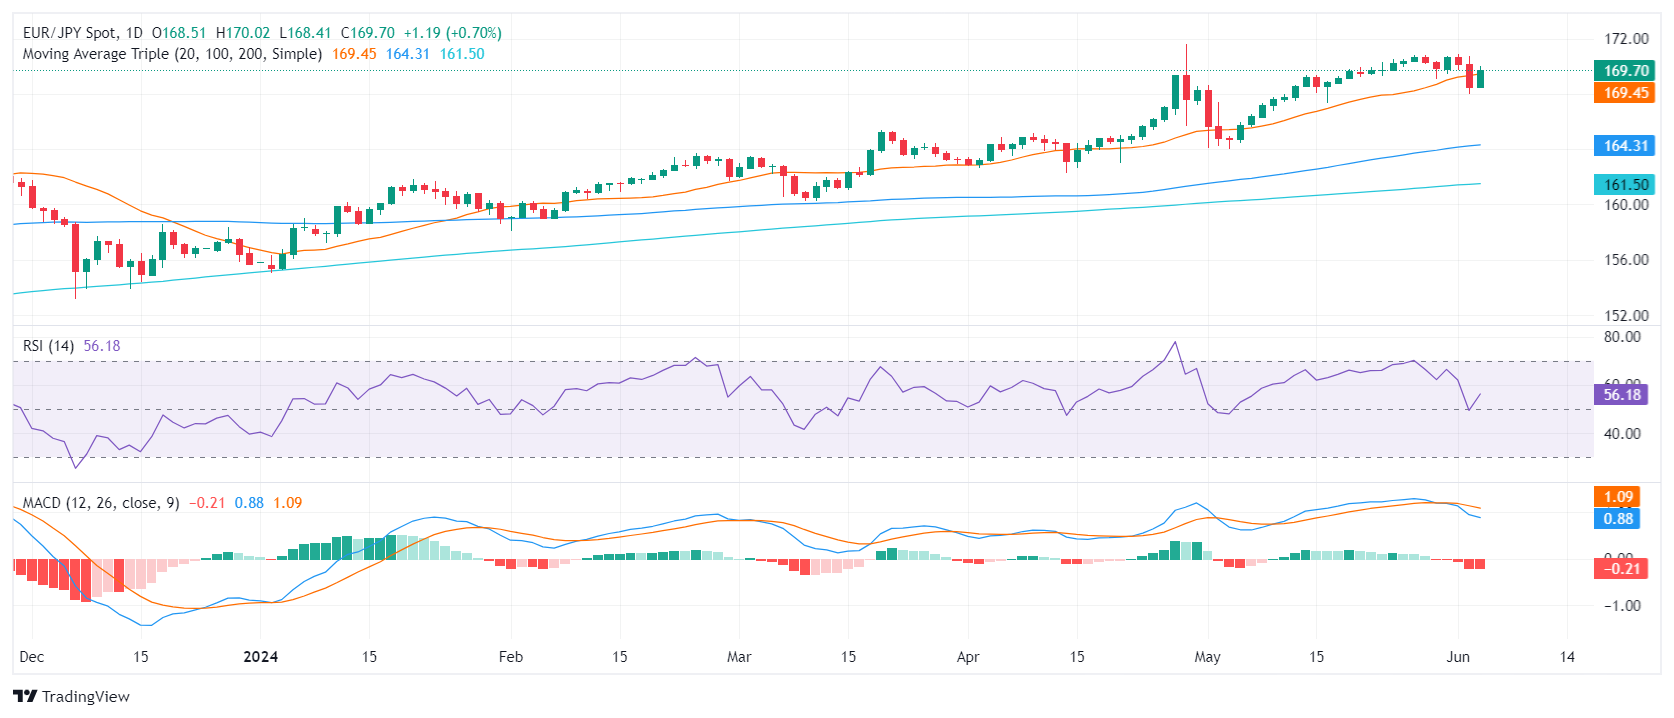
Despite the bearish undertones in the short term, the overall bullish trend remains unaffected. The support offered by the 100 and 200-day Simple Moving Averages (SMAs) at 164.00 and 161.00, respectively, still serve as a barrier to any prolonged downside movements. While sellers have made significant ground in previous sessions, these movements could be corrective rather than trend-reversing.
Although the cross managed to recover ground, the picture could quickly shift back to bearish if the cross fails to hold the recently-gained 169.40 resistance level. For the bulls to maintain momentum, a break back above this level is necessary, which would allow the pair to target the next key level of 170.00.


© 2000-2026. Bản quyền Teletrade.
Trang web này được quản lý bởi Teletrade D.J. LLC 2351 LLC 2022 (Euro House, Richmond Hill Road, Kingstown, VC0100, St. Vincent and the Grenadines).
Thông tin trên trang web không phải là cơ sở để đưa ra quyết định đầu tư và chỉ được cung cấp cho mục đích làm quen.
Giao dịch trên thị trường tài chính (đặc biệt là giao dịch sử dụng các công cụ biên) mở ra những cơ hội lớn và tạo điều kiện cho các nhà đầu tư sẵn sàng mạo hiểm để thu lợi nhuận, tuy nhiên nó mang trong mình nguy cơ rủi ro khá cao. Chính vì vậy trước khi tiến hành giao dịch cần phải xem xét mọi mặt vấn đề chấp nhận tiến hành giao dịch cụ thể xét theo quan điểm của nguồn lực tài chính sẵn có và mức độ am hiểu thị trường tài chính.
Sử dụng thông tin: sử dụng toàn bộ hay riêng biệt các dữ liệu trên trang web của công ty TeleTrade như một nguồn cung cấp thông tin nhất định. Việc sử dụng tư liệu từ trang web cần kèm theo liên kết đến trang teletrade.vn. Việc tự động thu thập số liệu cũng như thông tin từ trang web TeleTrade đều không được phép.
Xin vui lòng liên hệ với pr@teletrade.global nếu có câu hỏi.
ngân hàng