- Phân tích
- Tin tức và các công cụ
- Tin tức thị trường
- USD/JPY Price Analysis: Erases previous-day losses and climbs above 156.00
USD/JPY Price Analysis: Erases previous-day losses and climbs above 156.00
- USD/JPY climbs and gains 0.79%, supported by strong US economic data.
- Technical outlook shows a bullish harami pattern, indicating potential for further gains.
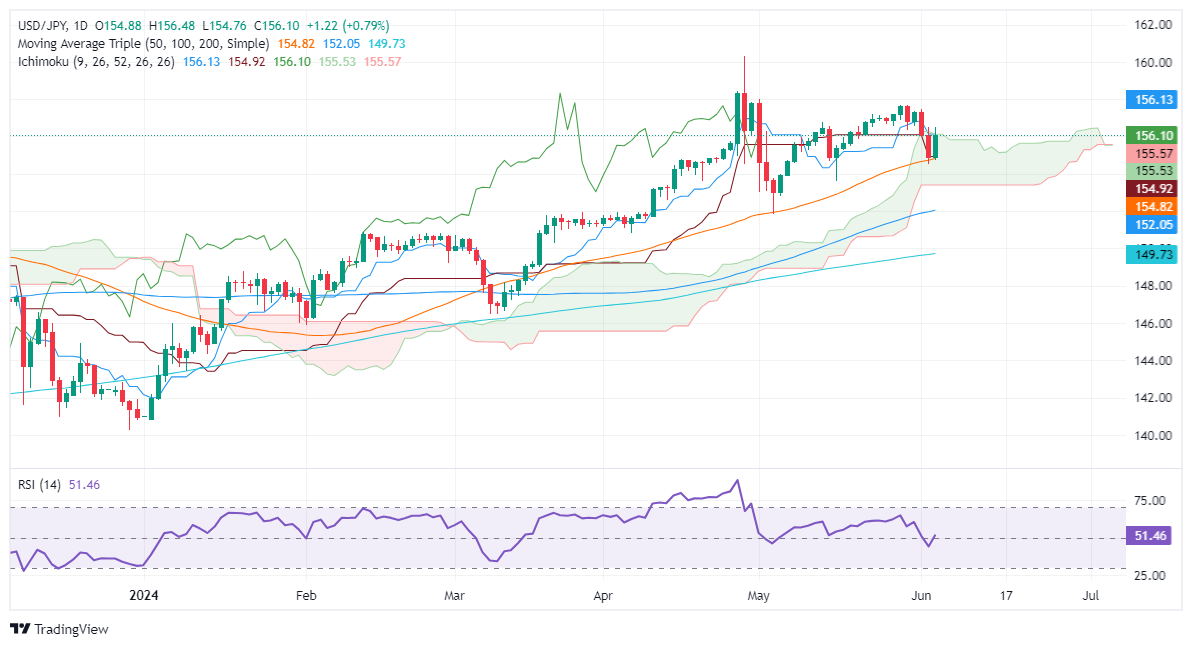
- Key resistance levels: 156.50, May 30 high at 157.68, and YTD high at 160.32; support at 156.00, 155.00, and confluence of Tenkan-Sen and 50-DMA at 154.81/92.
The USD/JPY recovered some ground and advanced towards the top of the Ichimoku Cloud (Kumo) on Wednesday, gaining some 0.79% and trading at 156.11 at the time of writing. Data from the United States kept the Greenback bid while falling Japanese Government Bond (JGB) yields undermined the Yen.
USD/JPY Price Analysis: Technical outlook
From a technical perspective, the USD/JPY remains upward biased despite retreating toward the 50-day moving average (DMA) at 154.82 on Tuesday. However, buyers lifted the exchange rate towards current levels, forming a ‘bullish harami’ candlestick chart pattern that could open the door for further gains.
Short-term momentum is on the buyers’ side, as depicted by the Relative Strength Index (RSI) standing in bullish territory.
The USD/JPY first resistance would be the 156.50 mark. A breach of the latte will expose the May 30 high of 157.68 before rallying toward the April 26 high of 158.44. Up next would be the year-to-date (YTD) high of 160.32.
On the flip side, the USD/JPY's first support would be 156.00. Once surpassed, the next stop would be 155.00, before testing the confluence of the Tenkan-Sen and the 50-DMA at around 154.81/92.
USD/JPY Price Action – Daily Chart


© 2000-2026. Bản quyền Teletrade.
Trang web này được quản lý bởi Teletrade D.J. LLC 2351 LLC 2022 (Euro House, Richmond Hill Road, Kingstown, VC0100, St. Vincent and the Grenadines).
Thông tin trên trang web không phải là cơ sở để đưa ra quyết định đầu tư và chỉ được cung cấp cho mục đích làm quen.
Giao dịch trên thị trường tài chính (đặc biệt là giao dịch sử dụng các công cụ biên) mở ra những cơ hội lớn và tạo điều kiện cho các nhà đầu tư sẵn sàng mạo hiểm để thu lợi nhuận, tuy nhiên nó mang trong mình nguy cơ rủi ro khá cao. Chính vì vậy trước khi tiến hành giao dịch cần phải xem xét mọi mặt vấn đề chấp nhận tiến hành giao dịch cụ thể xét theo quan điểm của nguồn lực tài chính sẵn có và mức độ am hiểu thị trường tài chính.
Sử dụng thông tin: sử dụng toàn bộ hay riêng biệt các dữ liệu trên trang web của công ty TeleTrade như một nguồn cung cấp thông tin nhất định. Việc sử dụng tư liệu từ trang web cần kèm theo liên kết đến trang teletrade.vn. Việc tự động thu thập số liệu cũng như thông tin từ trang web TeleTrade đều không được phép.
Xin vui lòng liên hệ với pr@teletrade.global nếu có câu hỏi.
ngân hàng