- Phân tích
- Tin tức và các công cụ
- Tin tức thị trường
- GBP/USD Price Analysis: Stays firm after strong US data, bears eye 1.2700
GBP/USD Price Analysis: Stays firm after strong US data, bears eye 1.2700
- GBP/USD remains unchanged after ISM Services PMI indicates economic expansion in May.
- Technical outlook shows neutral to upward bias, but resistance at 1.2800 limits gains.
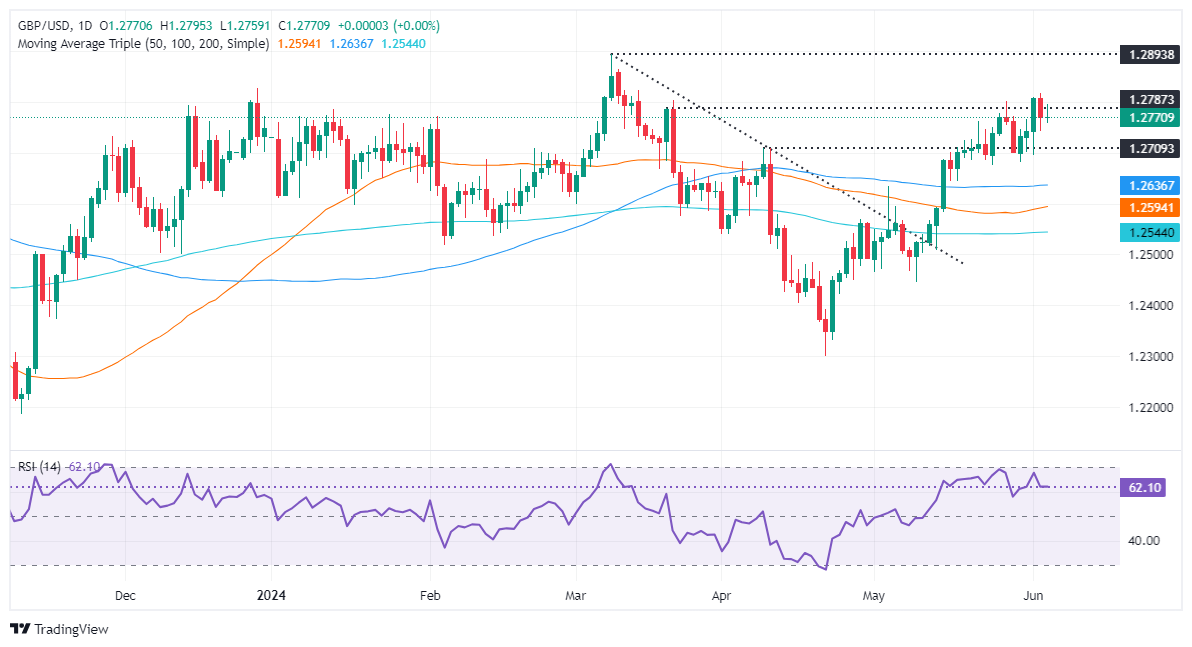
- Key levels: Support at 1.2742, 1.2700, and 1.2634; Resistance at 1.2800, YTD high at 1.2893, and 1.2900.
The GBP/USD is virtually unchanged in early trading during the North American session, following the release of the Institute for Supply Management (ISM) Services PMI, which showed the economy remains resilient, expanded in May above estimates and the previous month's reading, contrarily to manufacturing activity. Therefore, the major trades at 1.2768, almost flat.
GBP/USD Price Analysis: Technical outlook
Looking at the daily chart, the GBP/USD is showing a neutral to upward bias. However, the failure to break through the confluence of a three-month-old downslope resistance trendline and the 1.2800 figure has led to a further decline in Cable’s value.
Momentum remains supportive of buyers, as the Relative Strength Index (RSI) shifted almost flat, though in bullish territory, while price action hints at bearish signals.
If sellers push the GBP/USD below yesterday’s low of 1.2742, a drop toward 1.2700 is on the cards. Further losses are seen beneath the June 3 low of 1.2694, like the confluence of the 100-day moving average (DMA) and the May 3 high of 1.2634.
Conversely, if buyers keep the exchange rate within the 1.2740 – 1.2800 range, they could lift the spot prices and challenge the abovementioned confluence, at around the top of the range. Gains lie overhead at the year-to-date (YTD) high of 1.2893, followed by the 1.2900 mark.
GBP/USD Price Action – Daily Chart


© 2000-2026. Bản quyền Teletrade.
Trang web này được quản lý bởi Teletrade D.J. LLC 2351 LLC 2022 (Euro House, Richmond Hill Road, Kingstown, VC0100, St. Vincent and the Grenadines).
Thông tin trên trang web không phải là cơ sở để đưa ra quyết định đầu tư và chỉ được cung cấp cho mục đích làm quen.
Giao dịch trên thị trường tài chính (đặc biệt là giao dịch sử dụng các công cụ biên) mở ra những cơ hội lớn và tạo điều kiện cho các nhà đầu tư sẵn sàng mạo hiểm để thu lợi nhuận, tuy nhiên nó mang trong mình nguy cơ rủi ro khá cao. Chính vì vậy trước khi tiến hành giao dịch cần phải xem xét mọi mặt vấn đề chấp nhận tiến hành giao dịch cụ thể xét theo quan điểm của nguồn lực tài chính sẵn có và mức độ am hiểu thị trường tài chính.
Sử dụng thông tin: sử dụng toàn bộ hay riêng biệt các dữ liệu trên trang web của công ty TeleTrade như một nguồn cung cấp thông tin nhất định. Việc sử dụng tư liệu từ trang web cần kèm theo liên kết đến trang teletrade.vn. Việc tự động thu thập số liệu cũng như thông tin từ trang web TeleTrade đều không được phép.
Xin vui lòng liên hệ với pr@teletrade.global nếu có câu hỏi.
ngân hàng