- Phân tích
- Tin tức và các công cụ
- Tin tức thị trường
- EUR/JPY Price Analysis: The key upside barrier emerges above 170.00
EUR/JPY Price Analysis: The key upside barrier emerges above 170.00
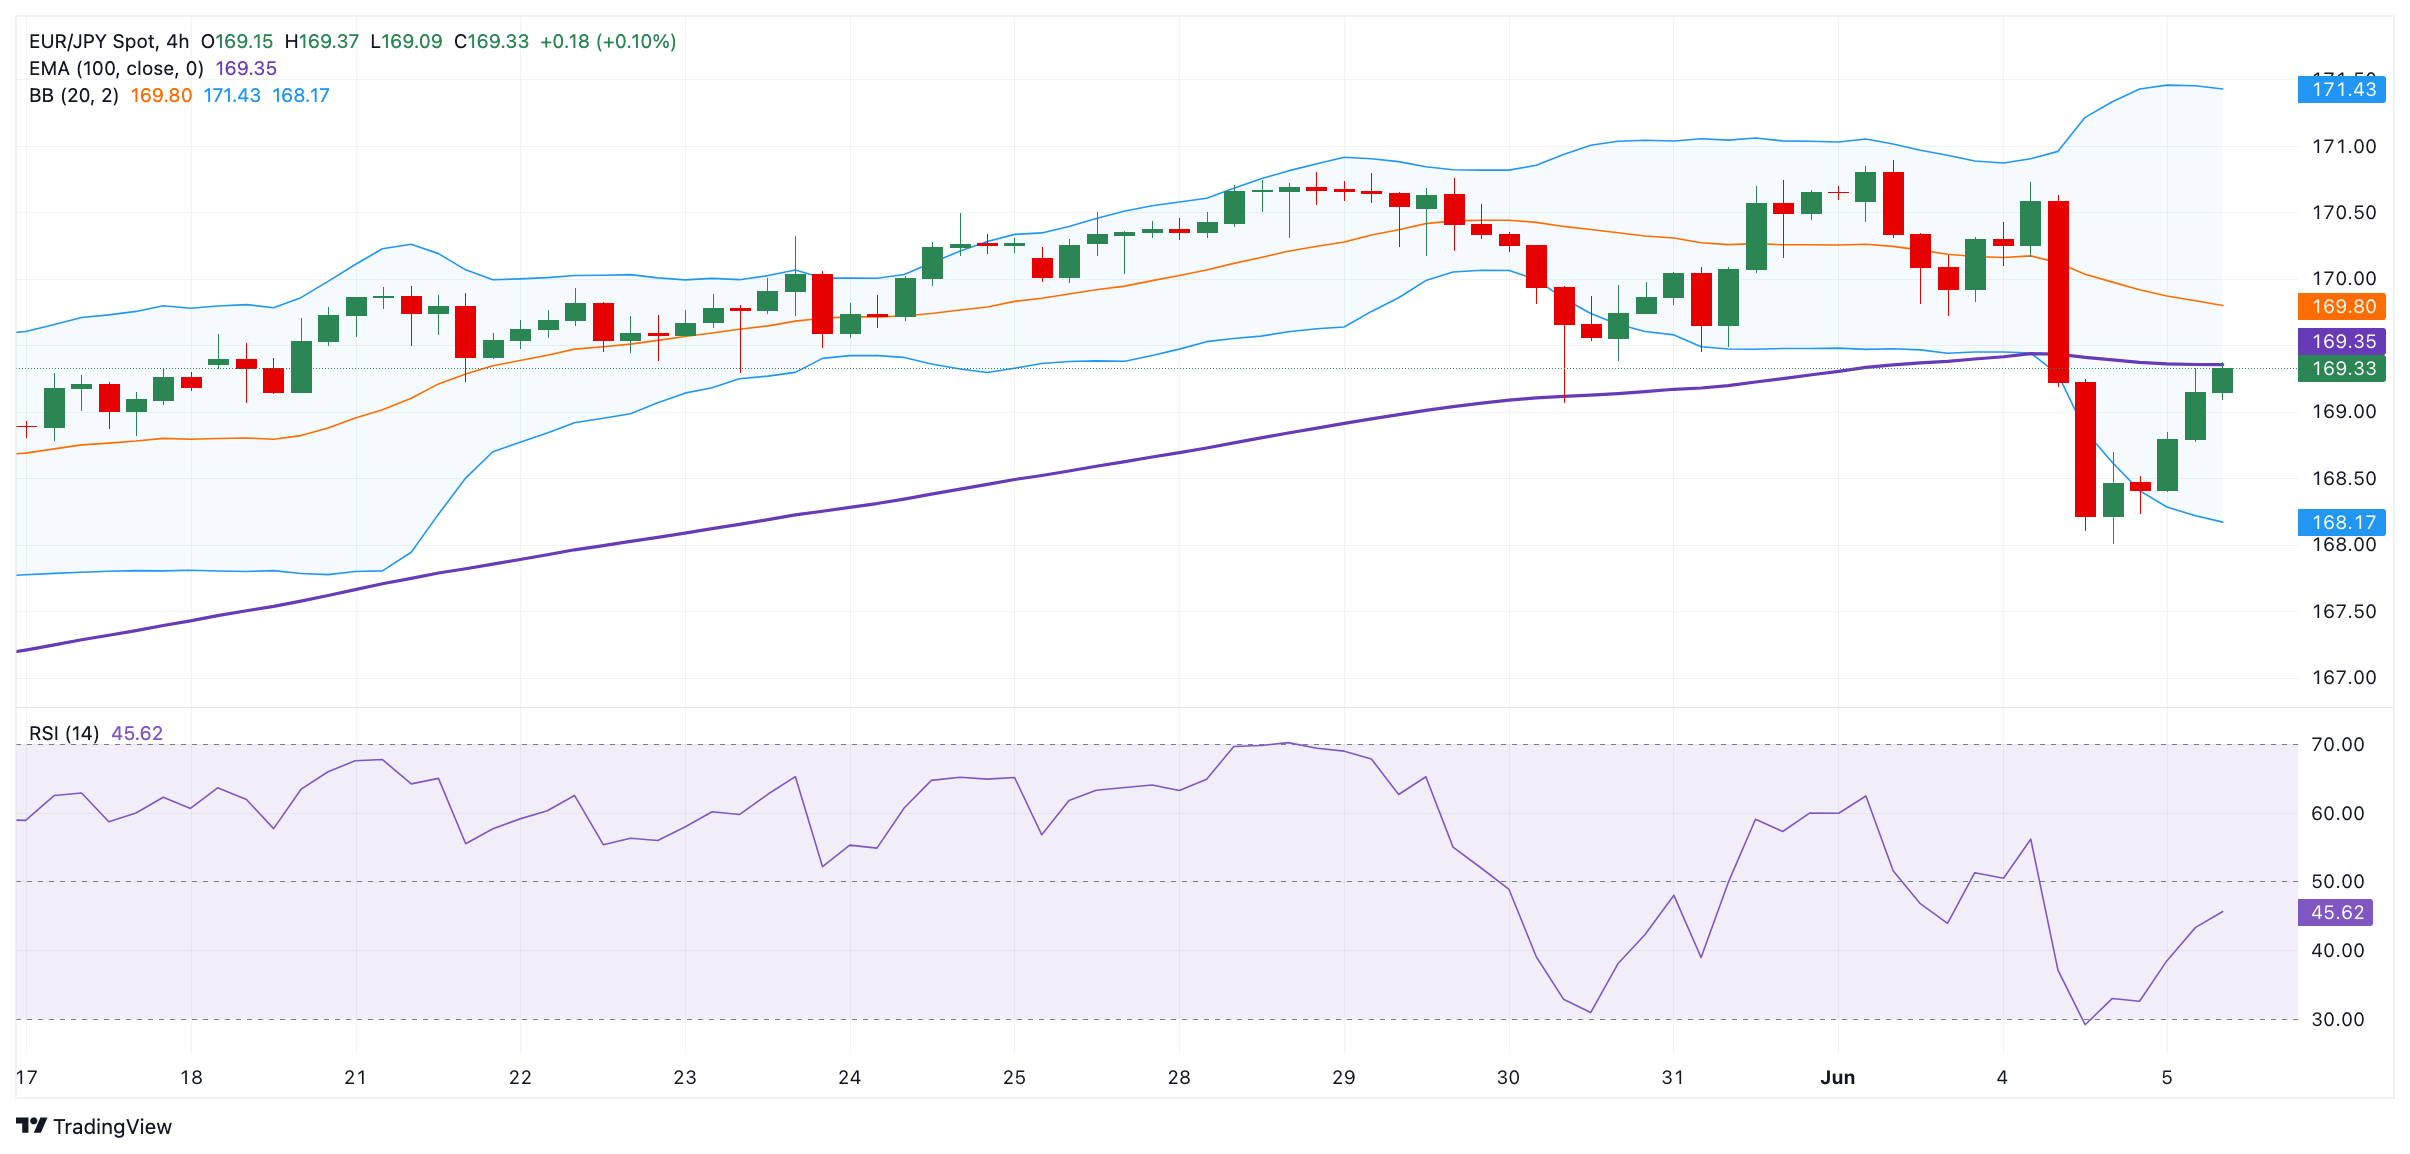
- EUR/JPY attracts some buyers near 169.30 in Wednesday’s early European session, up 0.50% on the day.
- The cross keeps the negative picture unchanged below the 100-period EMA, with the bearish RSI on 4-hour chart.
- The key upside barrier is seen at the 170.00 psychological level; the initial support level is located at 168.15.
The EUR/JPY cross snaps the two-day losing streak around 169.30 during the early European session on Wednesday. Traders closely watch the European Central Bank (ECB) interest rate decision on Thursday, which is more likely to cut interest rates by 25 basis points (bps).
Technically, EUR/JPY maintains the bearish outlook as the cross holds below the 100-period Exponential Moving Averages (EMA) on the four-hour chart. The downward momentum is backed by the Relative Strength Index (RSI), which stands in the bearish zone near 44.00, indicating the path of least resistance is to the downside.
The cross could resume the upside if it can break above the 100-period EMA at 169.35. Further north, the crucial hurdle is seen at the 170.00 psychological round mark. Any follow-through buying will see a rally to a high of June 4 at 170.72 en route to the upper boundary of Bollinger Band at 171.43.
On the other hand, the initial support level is located near the lower limit of Bollinger Band at 168.15. A breach of the mentioned level could expose a low of May 16 at 167.33. The additional downside filter to watch is a low of May 7 at 165.64.
EUR/JPY 4-hour chart


© 2000-2026. Bản quyền Teletrade.
Trang web này được quản lý bởi Teletrade D.J. LLC 2351 LLC 2022 (Euro House, Richmond Hill Road, Kingstown, VC0100, St. Vincent and the Grenadines).
Thông tin trên trang web không phải là cơ sở để đưa ra quyết định đầu tư và chỉ được cung cấp cho mục đích làm quen.
Giao dịch trên thị trường tài chính (đặc biệt là giao dịch sử dụng các công cụ biên) mở ra những cơ hội lớn và tạo điều kiện cho các nhà đầu tư sẵn sàng mạo hiểm để thu lợi nhuận, tuy nhiên nó mang trong mình nguy cơ rủi ro khá cao. Chính vì vậy trước khi tiến hành giao dịch cần phải xem xét mọi mặt vấn đề chấp nhận tiến hành giao dịch cụ thể xét theo quan điểm của nguồn lực tài chính sẵn có và mức độ am hiểu thị trường tài chính.
Sử dụng thông tin: sử dụng toàn bộ hay riêng biệt các dữ liệu trên trang web của công ty TeleTrade như một nguồn cung cấp thông tin nhất định. Việc sử dụng tư liệu từ trang web cần kèm theo liên kết đến trang teletrade.vn. Việc tự động thu thập số liệu cũng như thông tin từ trang web TeleTrade đều không được phép.
Xin vui lòng liên hệ với pr@teletrade.global nếu có câu hỏi.
ngân hàng