- Phân tích
- Tin tức và các công cụ
- Tin tức thị trường
- GBP/USD Price Analysis: Remains close to over two-month peak, bullish potential intact
GBP/USD Price Analysis: Remains close to over two-month peak, bullish potential intact
- GBP/USD attracts fresh buying on Wednesday amid the underlying USD bearish tone.
- Divergent Fed-BoE policy expectations turn out to be another factor lending support.
- The technical setup favors bullish traders and supports prospects for additional gains.
The GBP/USD pair trades with a mild positive bias around the 1.2775-1.2780 area during the Asian session on Wednesday and remains well within the striking distance of its highest level since March 14 touched the previous day.
The US Dollar (USD) struggles to capitalize on the overnight bounce from over a two-month low in the wake of rising bets for an imminent interest rate cut by the Federal Reserve (Fed) later this year. Furthermore, expectations that the Bank of England (BoE) might keep interest rates at their current level for a little bit longer continue to underpin the British Pound (GBP) and act as a tailwind for the GBP/USD pair.
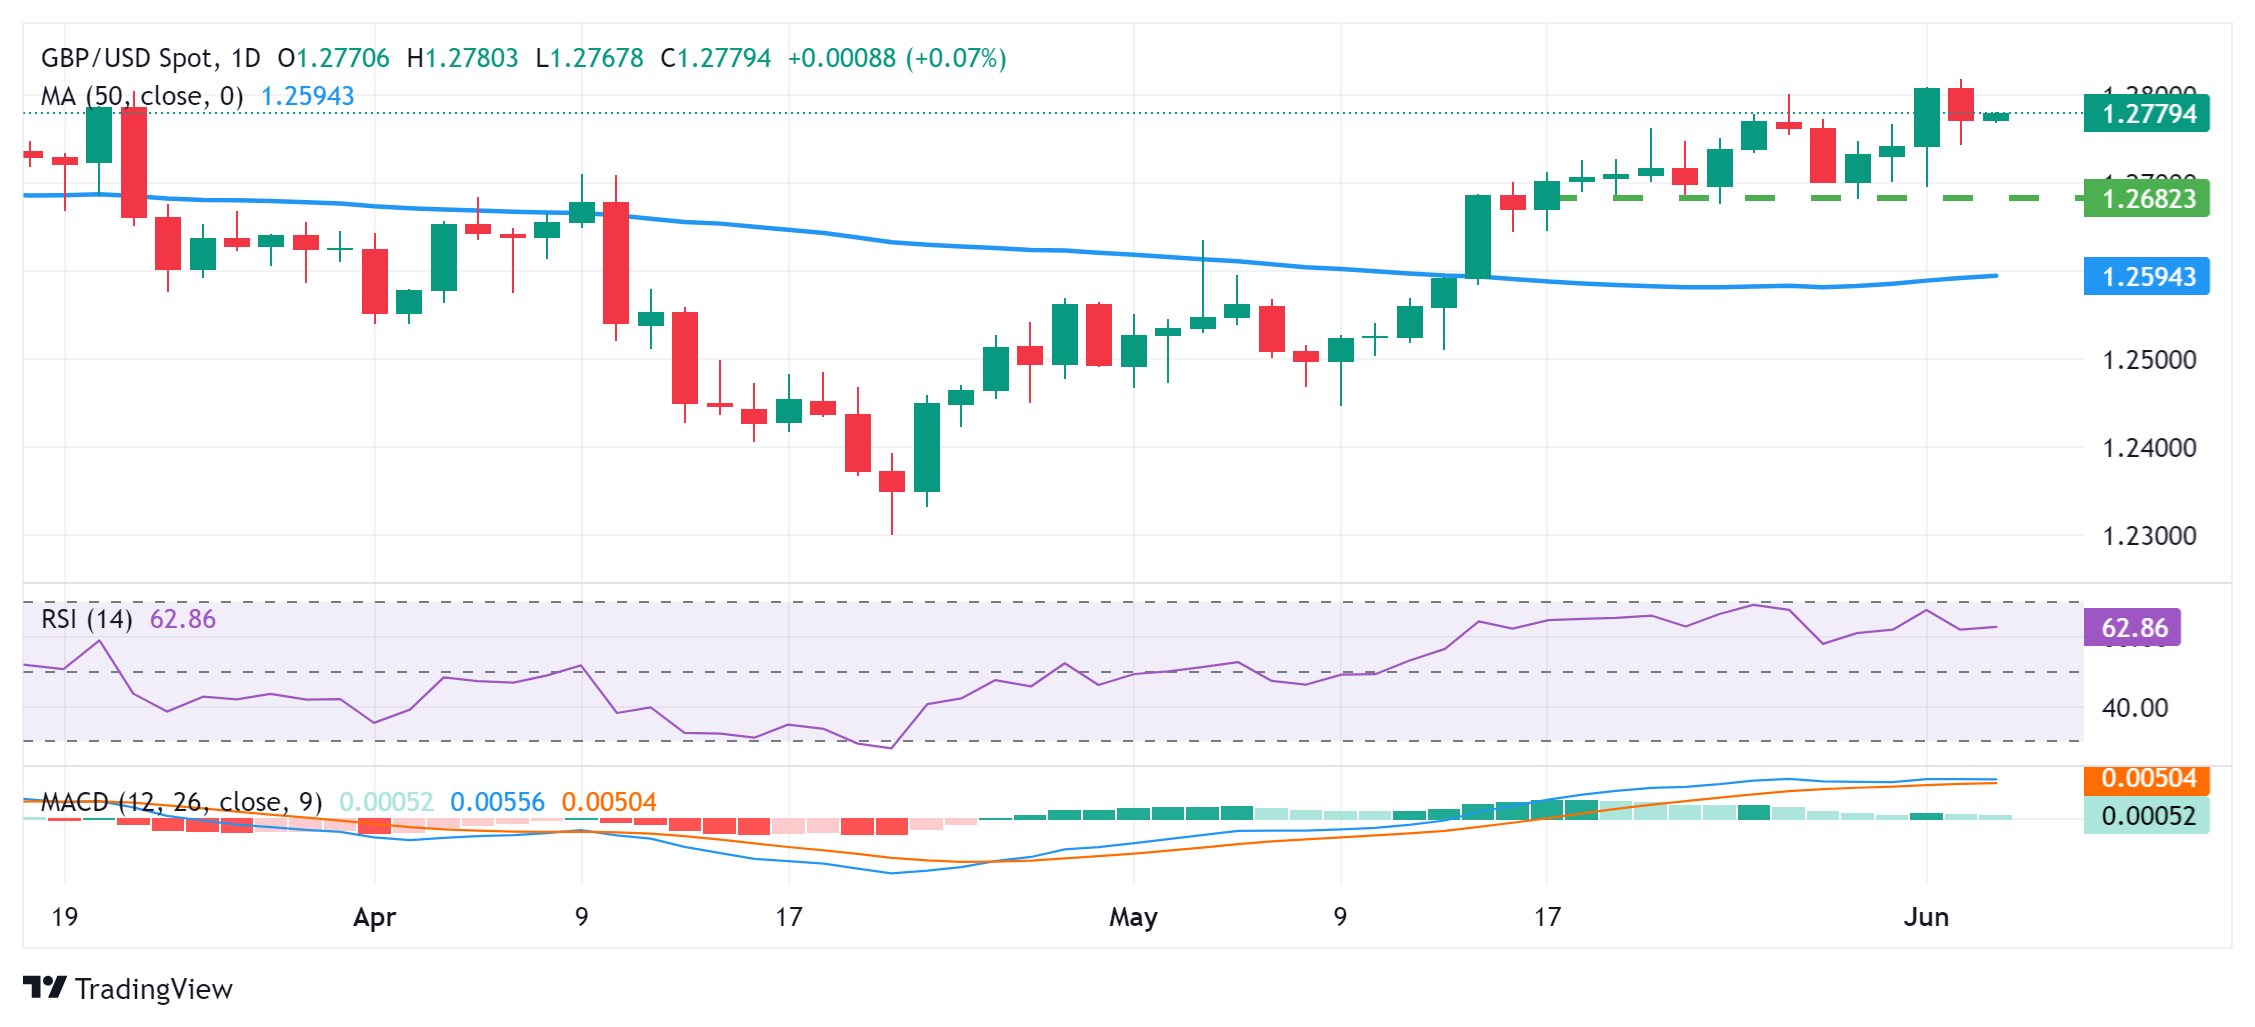
From a technical perspective, oscillators on the daily chart are holding in the positive territory and are still away from being in the overbought zone. This, in turn, supports prospects for further gains. Some follow-through buying beyond the 1.2800 mark will reaffirm the positive bias and lift the GBP/USD pair to the 1.2855-1.2860 area en route to the 1.2900 neighborhood or the YTD peak touched in March.
On the flip side, the overnight swing low, around the 1.2745-1.2740 region, now seems to protect the immediate downside ahead of the 1.2725-1.2720 area. The latter is followed by the 1.2700 mark, which if broken should pave the way for a slide towards the next relevant support near mid-1.2600s. Spot prices might eventually drop to test sub-1.2600 levels, or the 50-day Simple Moving Average (SMA) support.
GBP/USD daily chart


© 2000-2026. Bản quyền Teletrade.
Trang web này được quản lý bởi Teletrade D.J. LLC 2351 LLC 2022 (Euro House, Richmond Hill Road, Kingstown, VC0100, St. Vincent and the Grenadines).
Thông tin trên trang web không phải là cơ sở để đưa ra quyết định đầu tư và chỉ được cung cấp cho mục đích làm quen.
Giao dịch trên thị trường tài chính (đặc biệt là giao dịch sử dụng các công cụ biên) mở ra những cơ hội lớn và tạo điều kiện cho các nhà đầu tư sẵn sàng mạo hiểm để thu lợi nhuận, tuy nhiên nó mang trong mình nguy cơ rủi ro khá cao. Chính vì vậy trước khi tiến hành giao dịch cần phải xem xét mọi mặt vấn đề chấp nhận tiến hành giao dịch cụ thể xét theo quan điểm của nguồn lực tài chính sẵn có và mức độ am hiểu thị trường tài chính.
Sử dụng thông tin: sử dụng toàn bộ hay riêng biệt các dữ liệu trên trang web của công ty TeleTrade như một nguồn cung cấp thông tin nhất định. Việc sử dụng tư liệu từ trang web cần kèm theo liên kết đến trang teletrade.vn. Việc tự động thu thập số liệu cũng như thông tin từ trang web TeleTrade đều không được phép.
Xin vui lòng liên hệ với pr@teletrade.global nếu có câu hỏi.
ngân hàng