- Phân tích
- Tin tức và các công cụ
- Tin tức thị trường
- EUR/JPY Price Analysis: Bears assert their dominance, push the pair the below 20-day SMA
EUR/JPY Price Analysis: Bears assert their dominance, push the pair the below 20-day SMA
- The daily RSI has continued on its downward trajectory, backed by the rising red bards on the MACD.
- Previously strong support at 20-day SMA has been breached, opening the potential for further bearish movements in the short term.
- The existing bullish trend finds defense in the 100 and 200-day SMAs, around the 164.00 and 161.00 levels respectively.
In Tuesday's session, the EUR/JPY pair endured significant selling pressure pushing below the cross below the strong support level of the 20-day Simple Moving Average (SMA) at 169.30, and touching a low of 168.50. Although this bearish movement puts a dampener on the outlook over the short term, the overall bullish outlook remains unaffected.
This shift in momentum aligns with the downward turn noted in the daily Relative Strength Index (RSI), which now stands at 46, compared to the higher reading of 61 in Monday's session. This indicates a loss in buying momentum, echoed by the daily Moving Average Convergence Divergence (MACD) which exhibits increasing red bars.
EUR/JPY daily chart
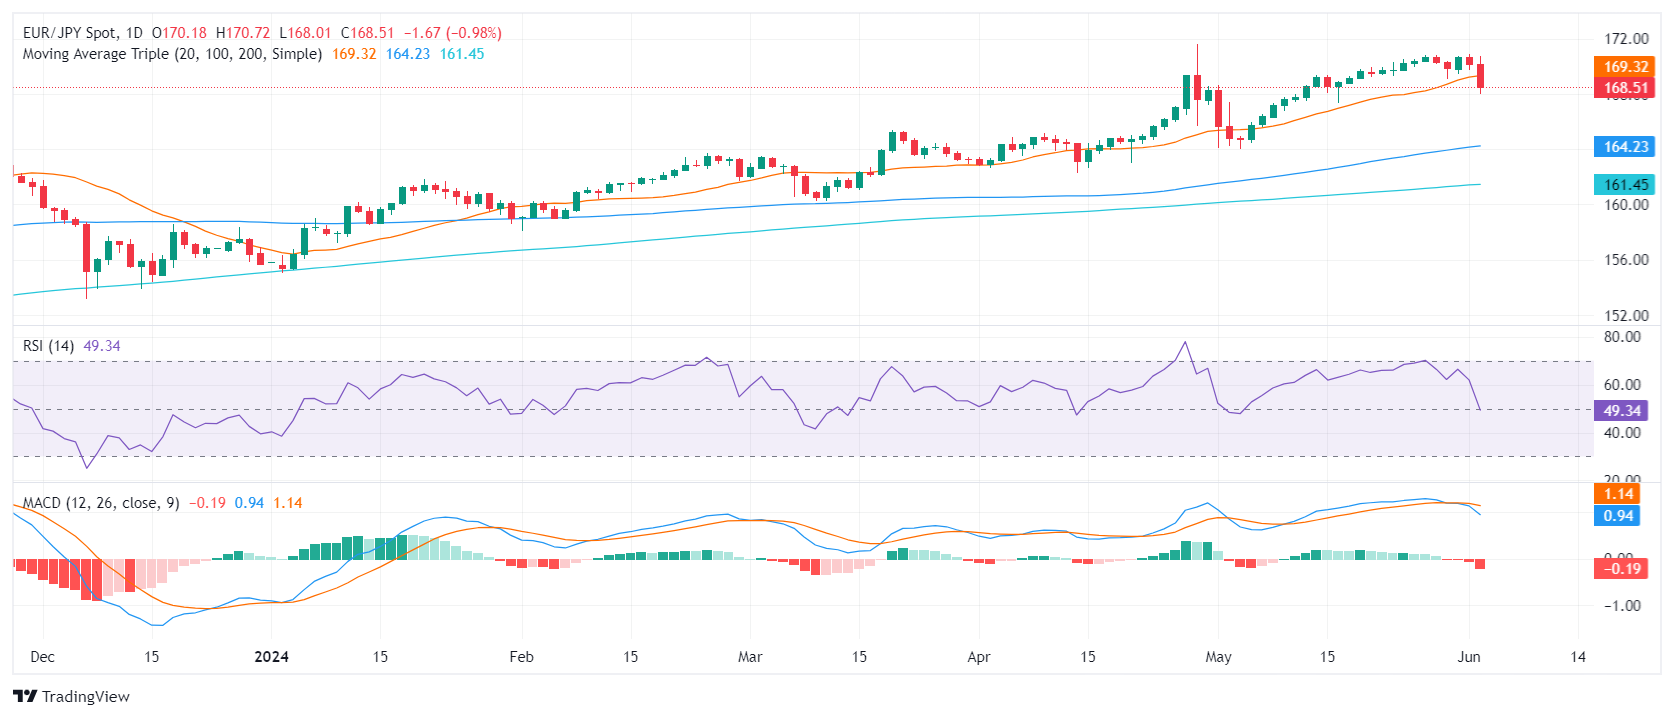
Looking at the broader picture, despite the short-term bearishness, the lengthy bullish trend remains unaffected for the moment. The support given by the 100 and 200-day Simple Moving Averages (SMAs) at 164.00 and 161.00 respectively will need to be broken in order to flip the table. Conversely, for the bulls to regain momentum, they will need to recapture the 169.30 region, which recently turned from support to resistance.


© 2000-2026. Bản quyền Teletrade.
Trang web này được quản lý bởi Teletrade D.J. LLC 2351 LLC 2022 (Euro House, Richmond Hill Road, Kingstown, VC0100, St. Vincent and the Grenadines).
Thông tin trên trang web không phải là cơ sở để đưa ra quyết định đầu tư và chỉ được cung cấp cho mục đích làm quen.
Giao dịch trên thị trường tài chính (đặc biệt là giao dịch sử dụng các công cụ biên) mở ra những cơ hội lớn và tạo điều kiện cho các nhà đầu tư sẵn sàng mạo hiểm để thu lợi nhuận, tuy nhiên nó mang trong mình nguy cơ rủi ro khá cao. Chính vì vậy trước khi tiến hành giao dịch cần phải xem xét mọi mặt vấn đề chấp nhận tiến hành giao dịch cụ thể xét theo quan điểm của nguồn lực tài chính sẵn có và mức độ am hiểu thị trường tài chính.
Sử dụng thông tin: sử dụng toàn bộ hay riêng biệt các dữ liệu trên trang web của công ty TeleTrade như một nguồn cung cấp thông tin nhất định. Việc sử dụng tư liệu từ trang web cần kèm theo liên kết đến trang teletrade.vn. Việc tự động thu thập số liệu cũng như thông tin từ trang web TeleTrade đều không được phép.
Xin vui lòng liên hệ với pr@teletrade.global nếu có câu hỏi.
ngân hàng