- Phân tích
- Tin tức và các công cụ
- Tin tức thị trường
- Gold sells off in line with technicals and US Dollar bounce
Gold sells off in line with technicals and US Dollar bounce
- Gold is falling in line with a bearish short-term technical picture and a US Dollar bounce.
- Lower global inflation expectations are prompting investors to rotate into bonds, possibly draining investment away from Gold.
- XAU/USD technicals indicate the potential for more downside following a recent trendline break.
Gold (XAU/USD) trades over three quarters of a percent lower in the $2,330s on Tuesday. A slight bounce from the US Dollar (USD), which is negatively correlated to Gold, could be partly responsible as could asset rotation into bonds. Commodities in general are trading lower – and the move is in line with Gold technicals which are short-term bearish.
Gold weakens as broader commodity markets sell-off
The lion’s share of commodities and most equity markets are selling off on Tuesday, which – apart from idiosyncratic reasons such as the OPEC+ decision and Indian elections – seems to be a result of generalized fears about global economic growth. This seems to be due to the poor US ISM Manufacturing PMI data released on Monday. Another reason could be asset rotation as increasing numbers of investors reallocate to bonds.
There are growing signs inflation is falling globally, with Friday’s US core PCE data undershooting estimates and Swiss inflation similarly missing the mark on Tuesday, after coming out at 0.3% month-over-month in May when economists had estimated a 0.4% rise.
The Swiss CPI data has sparked speculation the Swiss National Bank (SNB) could make another interest rate cut at its meeting in June. With the European central Bank (ECB) highly anticipated to cut interest rates on Thursday and increasing speculation the Bank of Canada (BoC) could also cut rates on Wednesday, global bond markets are rallying and could be draining investment from Gold.
Technical Analysis: Gold trades along 50-day SMA
Gold price is finding support at the 50-day Simple Moving Average (SMA) and consolidating after a sell-off from the May highs.
XAU/USD has broken through a major trendline and is probably in a short-term downtrend. Given “the trend is your friend” the odds favor more weakness.
XAU/USD Daily Chart
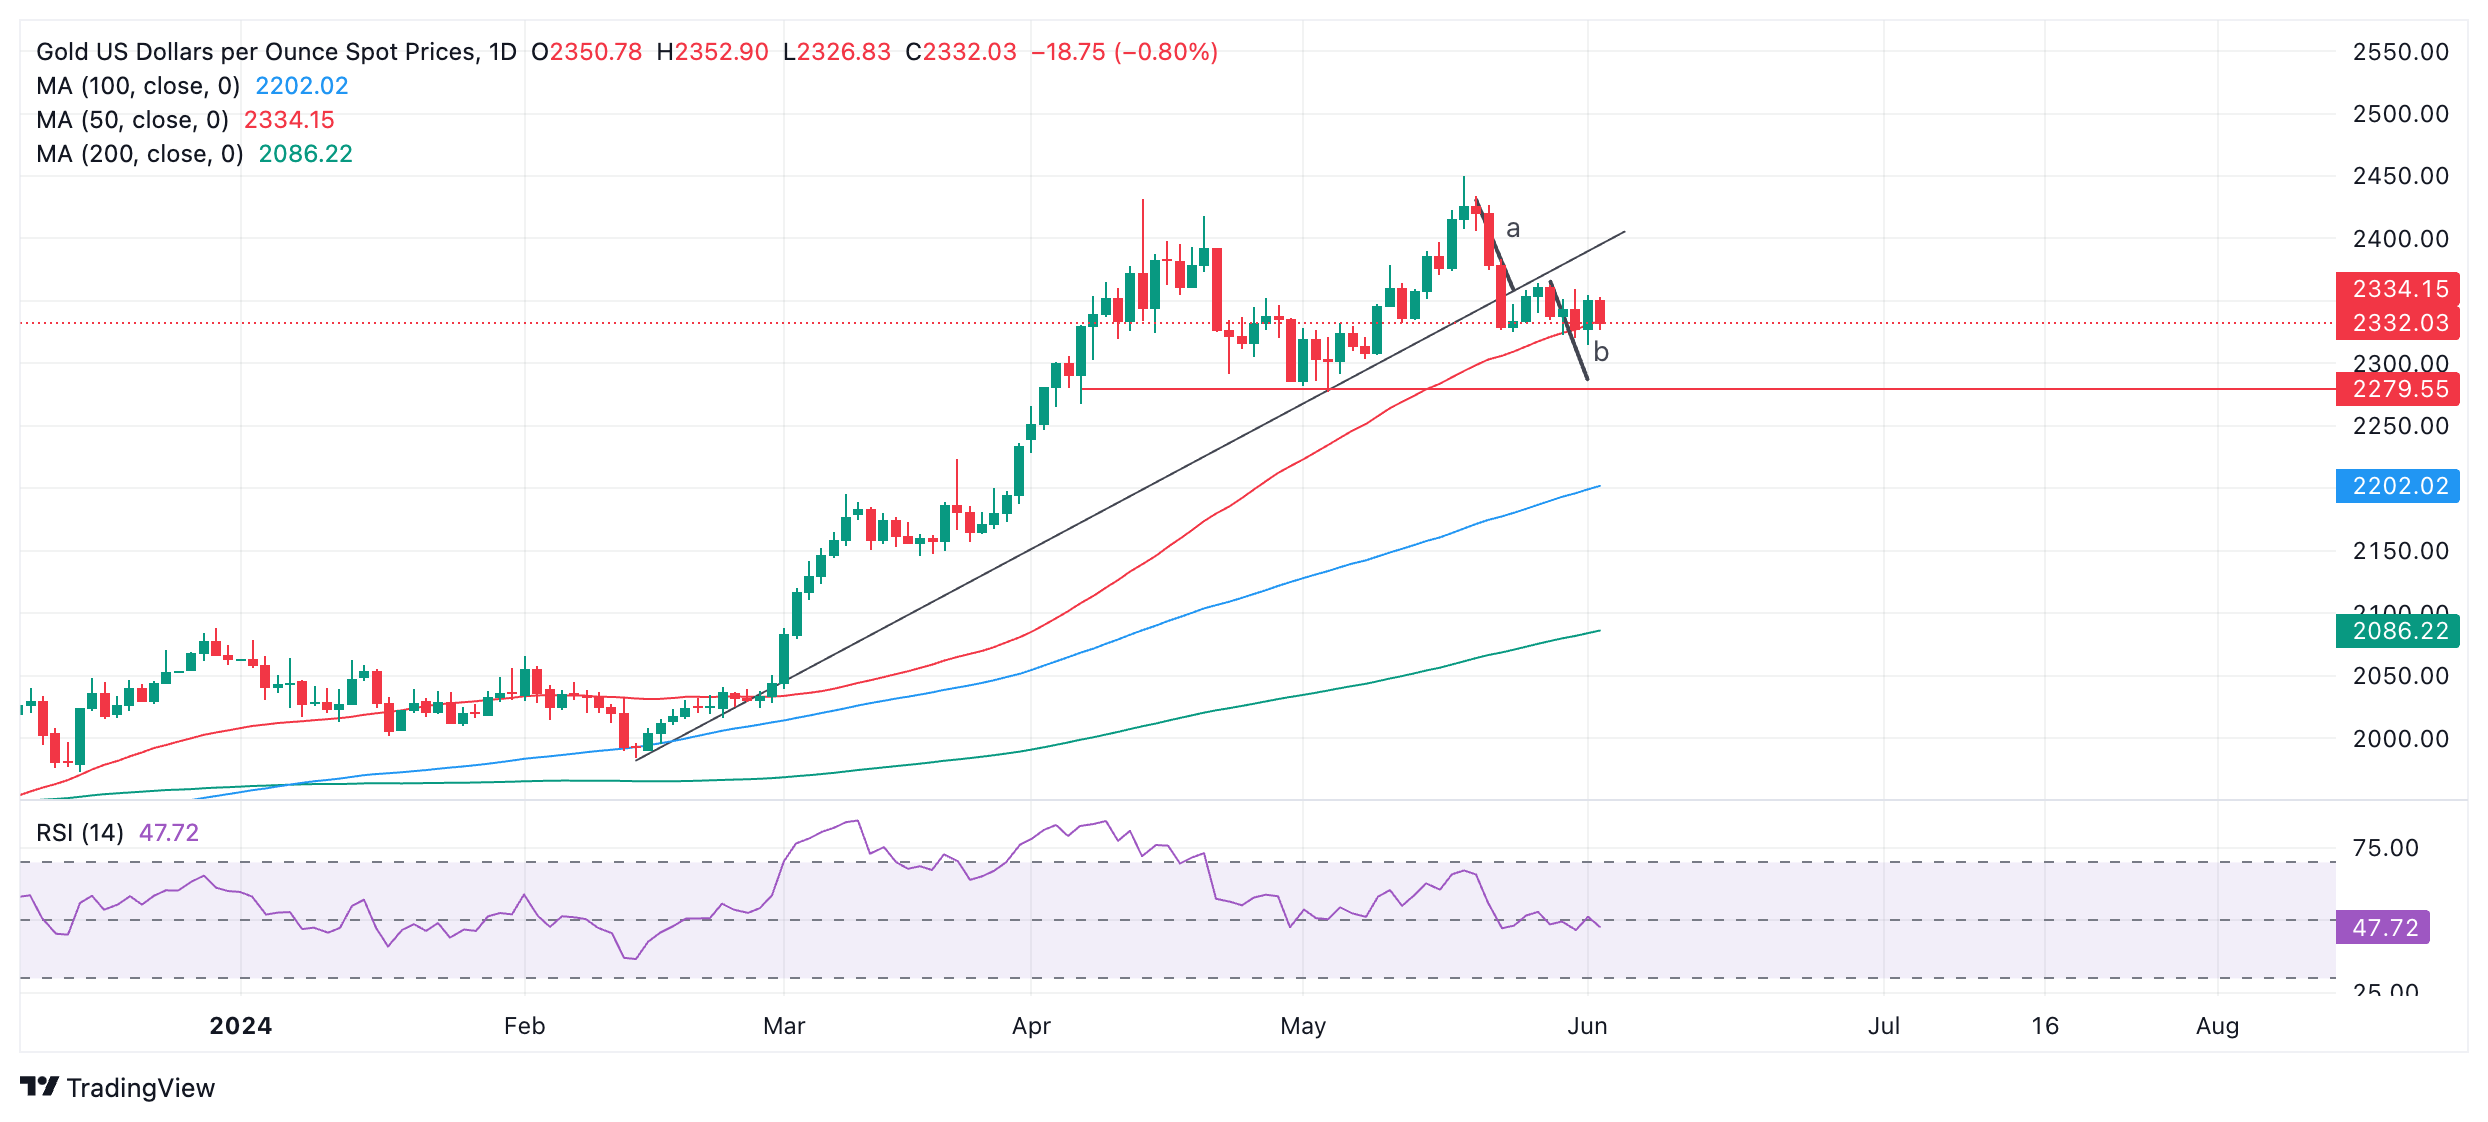
The trendline break generated downside targets. The length of the move prior to a break can be used as a guide to the follow-through after a break, according to technical analysis. In the case of Gold, these have been labeled “a” and “b” respectively.
The first target is at $2,303, which is the 0.618 Fibonacci extrapolation of “a”.
Gold could even fall to $2,272-$2,279, the 100% extrapolation of “a” and the end of “b”. This also happens to be an area of historical support (red line).
The precious metal’s medium and long-term trends, however, are still bullish and the risk of a recovery remains high. That said, price action is not supporting a resumption hypothesis at the moment.
A break above $2,362 (May 29 high) would be required to bring into doubt the integrity of the short-term downtrend, otherwise further weakness is foreseen.
Economic Indicator
ISM Manufacturing PMI
The Institute for Supply Management (ISM) Manufacturing Purchasing Managers Index (PMI), released on a monthly basis, is a leading indicator gauging business activity in the US manufacturing sector. The indicator is obtained from a survey of manufacturing supply executives based on information they have collected within their respective organizations. Survey responses reflect the change, if any, in the current month compared to the previous month. A reading above 50 indicates that the manufacturing economy is generally expanding, a bullish sign for the US Dollar (USD). A reading below 50 signals that factory activity is generally declining, which is seen as bearish for USD.
Read more.Last release: Mon Jun 03, 2024 14:00
Frequency: Monthly
Actual: 48.7
Consensus: 49.6
Previous: 49.2
Source: Institute for Supply Management
The Institute for Supply Management’s (ISM) Manufacturing Purchasing Managers Index (PMI) provides a reliable outlook on the state of the US manufacturing sector. A reading above 50 suggests that the business activity expanded during the survey period and vice versa. PMIs are considered to be leading indicators and could signal a shift in the economic cycle. Stronger-than-expected prints usually have a positive impact on the USD. In addition to the headline PMI, the Employment Index and the Prices Paid Index numbers are watched closely as they shine a light on the labour market and inflation.


© 2000-2026. Bản quyền Teletrade.
Trang web này được quản lý bởi Teletrade D.J. LLC 2351 LLC 2022 (Euro House, Richmond Hill Road, Kingstown, VC0100, St. Vincent and the Grenadines).
Thông tin trên trang web không phải là cơ sở để đưa ra quyết định đầu tư và chỉ được cung cấp cho mục đích làm quen.
Giao dịch trên thị trường tài chính (đặc biệt là giao dịch sử dụng các công cụ biên) mở ra những cơ hội lớn và tạo điều kiện cho các nhà đầu tư sẵn sàng mạo hiểm để thu lợi nhuận, tuy nhiên nó mang trong mình nguy cơ rủi ro khá cao. Chính vì vậy trước khi tiến hành giao dịch cần phải xem xét mọi mặt vấn đề chấp nhận tiến hành giao dịch cụ thể xét theo quan điểm của nguồn lực tài chính sẵn có và mức độ am hiểu thị trường tài chính.
Sử dụng thông tin: sử dụng toàn bộ hay riêng biệt các dữ liệu trên trang web của công ty TeleTrade như một nguồn cung cấp thông tin nhất định. Việc sử dụng tư liệu từ trang web cần kèm theo liên kết đến trang teletrade.vn. Việc tự động thu thập số liệu cũng như thông tin từ trang web TeleTrade đều không được phép.
Xin vui lòng liên hệ với pr@teletrade.global nếu có câu hỏi.
ngân hàng