- Phân tích
- Tin tức và các công cụ
- Tin tức thị trường
- USD/CAD Price Analysis: Rises toward 1.3700 despite a bearish bias
USD/CAD Price Analysis: Rises toward 1.3700 despite a bearish bias
- USD/CAD gains ground despite a bearish bias suggested by daily chart analysis.
- The momentum indicator MACD also suggests a bearish trend for the pair.
- A break above the upper boundary of the descending channel and the psychological level of 1.3700 could weaken the bearish bias.
USD/CAD halts its three-day losing streak, trading around 1.3680 during the European hours on Tuesday. The appreciation of the pair is attributed to the decline in crude Oil prices, given the fact that Canada is the largest Oil exporter to the United States (US).
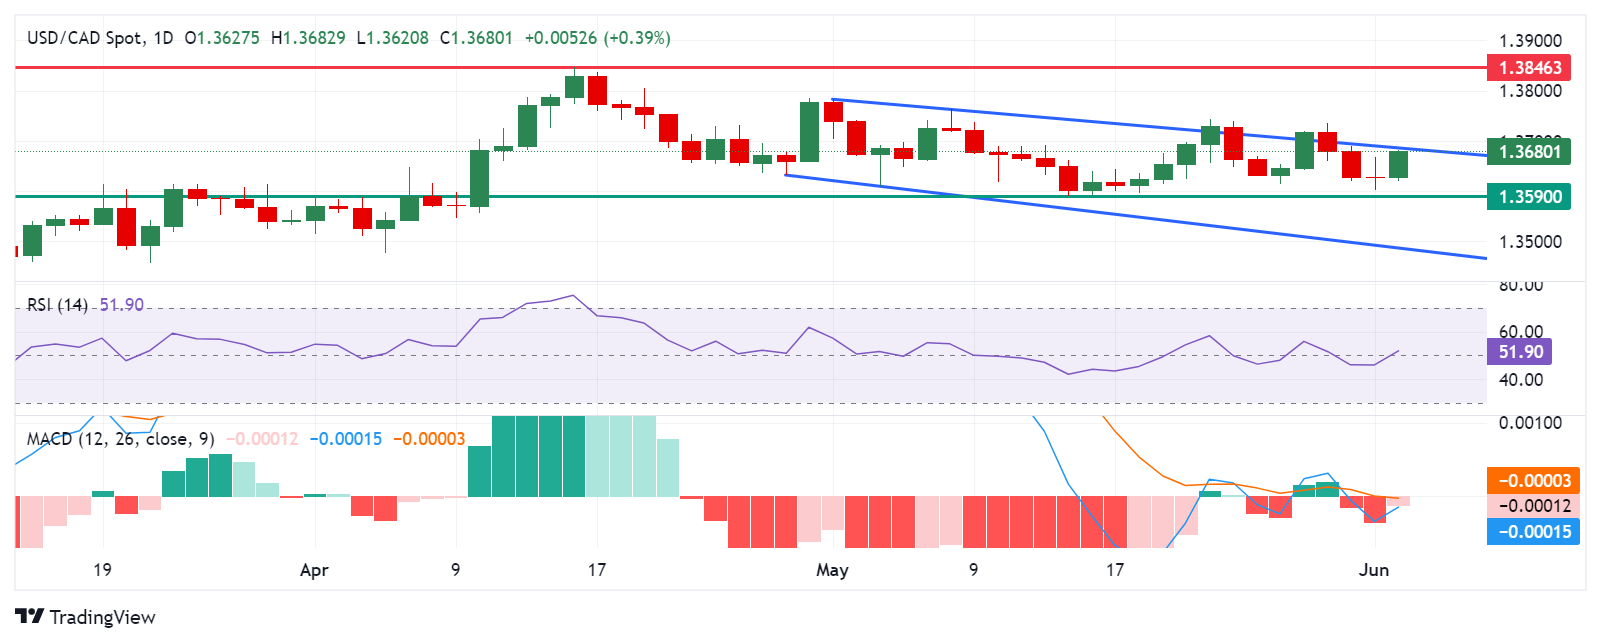
The analysis of the daily chart suggests the bearish bias for the USD/CAD pair, as it lies within the descending channel. Additionally, the 14-day Relative Strength Index (RSI) is positioned slightly above the 50 level, further movement may offer a clear directional trend.
The momentum indicator Moving Average Convergence Divergence (MACD) also suggests a bearish trend for the USD/CAD pair as the MACD line is positioned below the centerline and the signal line. However, the convergence below the signal line could lead to a momentum shift. A breakthrough above the centerline could weaken the bearish trend.
The USD/CAD pair could find the key support around the psychological level of 1.3600 and a throwback support of 1.3590. A break below this region could exert downward pressure on the pair to navigate around the significant level of 1.3500. Further support may appear at the lower threshold of the descending channel.
On the upside, the USD/CAD pair tests the upper boundary of the descending channel, followed by the psychological level of 1.3700. A breakthrough above the latter could weaken the bearish bias and lead the pair to explore the region around the key level of 1.3800, followed by April’s high of 1.3846.
USD/CAD: Daily Chart


© 2000-2026. Bản quyền Teletrade.
Trang web này được quản lý bởi Teletrade D.J. LLC 2351 LLC 2022 (Euro House, Richmond Hill Road, Kingstown, VC0100, St. Vincent and the Grenadines).
Thông tin trên trang web không phải là cơ sở để đưa ra quyết định đầu tư và chỉ được cung cấp cho mục đích làm quen.
Giao dịch trên thị trường tài chính (đặc biệt là giao dịch sử dụng các công cụ biên) mở ra những cơ hội lớn và tạo điều kiện cho các nhà đầu tư sẵn sàng mạo hiểm để thu lợi nhuận, tuy nhiên nó mang trong mình nguy cơ rủi ro khá cao. Chính vì vậy trước khi tiến hành giao dịch cần phải xem xét mọi mặt vấn đề chấp nhận tiến hành giao dịch cụ thể xét theo quan điểm của nguồn lực tài chính sẵn có và mức độ am hiểu thị trường tài chính.
Sử dụng thông tin: sử dụng toàn bộ hay riêng biệt các dữ liệu trên trang web của công ty TeleTrade như một nguồn cung cấp thông tin nhất định. Việc sử dụng tư liệu từ trang web cần kèm theo liên kết đến trang teletrade.vn. Việc tự động thu thập số liệu cũng như thông tin từ trang web TeleTrade đều không được phép.
Xin vui lòng liên hệ với pr@teletrade.global nếu có câu hỏi.
ngân hàng