- Phân tích
- Tin tức và các công cụ
- Tin tức thị trường
- USD/JPY Price Analysis: Struggles at 157.00 as bearish engulfing chart pattern looms
USD/JPY Price Analysis: Struggles at 157.00 as bearish engulfing chart pattern looms
- USD/JPY retreats as it forms a bearish engulfing candle chart pattern.
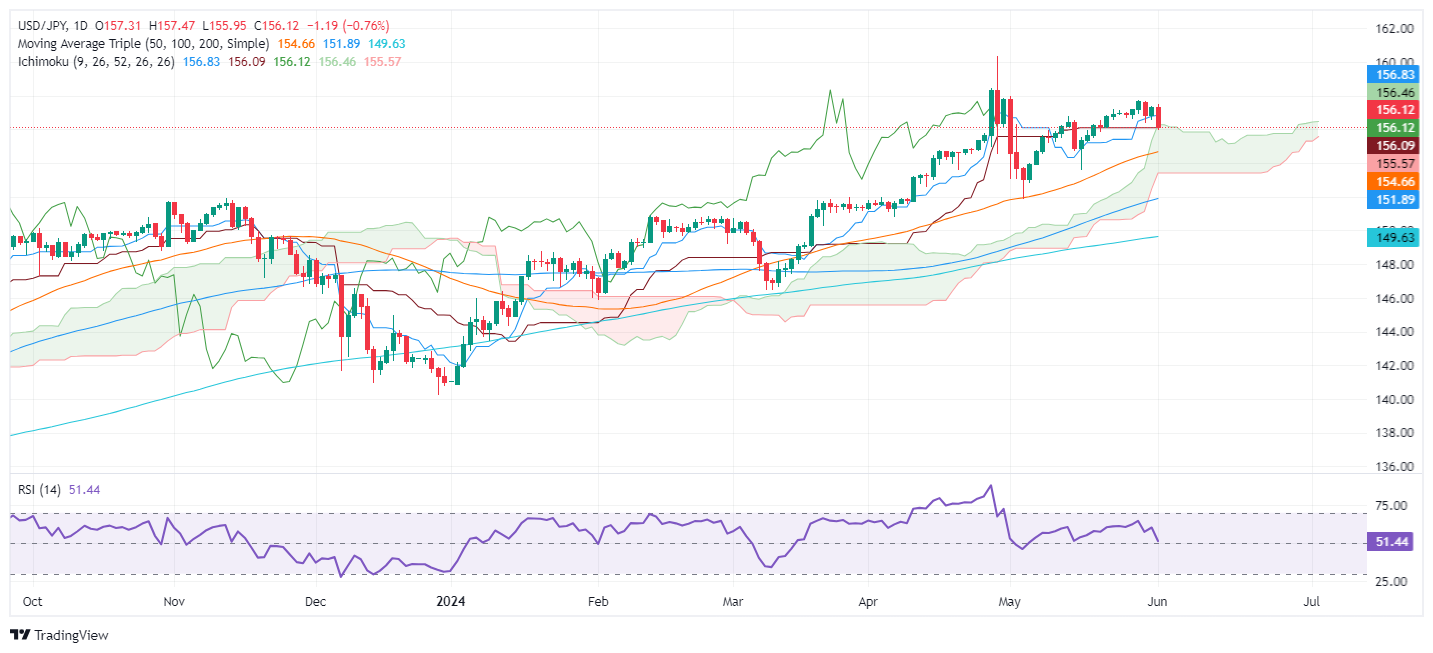
- Technical outlook: USD/JPY drops below Ichimoku Cloud top at 155.95, hinting at potential further declines.
- Key support levels: Tenkan-Sen at 154.92, 50-DMA at 154.74, and trendline at 154.20; resistance at Kumo top 156.15/20 and May 29 high of 157.71.
The USD/JPY retreated more than 0.70% on Monday following softer-than-expected business activity data in the United States (US). That, along with last Friday’s inflation report, the Fed’s Core PCE, reignited speculation that the US central bank could slash rates toward the end of the year. The pair trades at 156.14.
USD/JPY Price Analysis: Technical outlook
From a daily chart perspective, the USD/JPY failed to pierce the 157.50 resistance level and dived below the 157.00 figure, exacerbating a drop below the top of the Ichimoku Cloud (Kumo) at around 155.95, opening the door for further losses.
Even though momentum favors buyers, as depicted by the Relative Strength Index (RSI), it has turned flat close to the 50 midlines, about to enter bearish territory.
In the short term, the USD/JPY is neutral to downward biased. The first support would be the Tenkan-Sen at 154.92, followed by the 50-day moving average (DMA) at 154.74. Once cleared, the next stop would be an upslope support trendline at 154.20 before testing the bottom of the Kumo at 153.30/40.
Conversely, if USD/JPY climbs above the top of the Kumo at around 156.15/20, that would sponsor an uptick toward the May 29 high at 157.71.
USD/JPY Price Action – Daily Chart


© 2000-2026. Bản quyền Teletrade.
Trang web này được quản lý bởi Teletrade D.J. LLC 2351 LLC 2022 (Euro House, Richmond Hill Road, Kingstown, VC0100, St. Vincent and the Grenadines).
Thông tin trên trang web không phải là cơ sở để đưa ra quyết định đầu tư và chỉ được cung cấp cho mục đích làm quen.
Giao dịch trên thị trường tài chính (đặc biệt là giao dịch sử dụng các công cụ biên) mở ra những cơ hội lớn và tạo điều kiện cho các nhà đầu tư sẵn sàng mạo hiểm để thu lợi nhuận, tuy nhiên nó mang trong mình nguy cơ rủi ro khá cao. Chính vì vậy trước khi tiến hành giao dịch cần phải xem xét mọi mặt vấn đề chấp nhận tiến hành giao dịch cụ thể xét theo quan điểm của nguồn lực tài chính sẵn có và mức độ am hiểu thị trường tài chính.
Sử dụng thông tin: sử dụng toàn bộ hay riêng biệt các dữ liệu trên trang web của công ty TeleTrade như một nguồn cung cấp thông tin nhất định. Việc sử dụng tư liệu từ trang web cần kèm theo liên kết đến trang teletrade.vn. Việc tự động thu thập số liệu cũng như thông tin từ trang web TeleTrade đều không được phép.
Xin vui lòng liên hệ với pr@teletrade.global nếu có câu hỏi.
ngân hàng