- Phân tích
- Tin tức và các công cụ
- Tin tức thị trường
- EUR/JPY Price Analysis: Pair struggles to gain ground as momentum wanes
EUR/JPY Price Analysis: Pair struggles to gain ground as momentum wanes
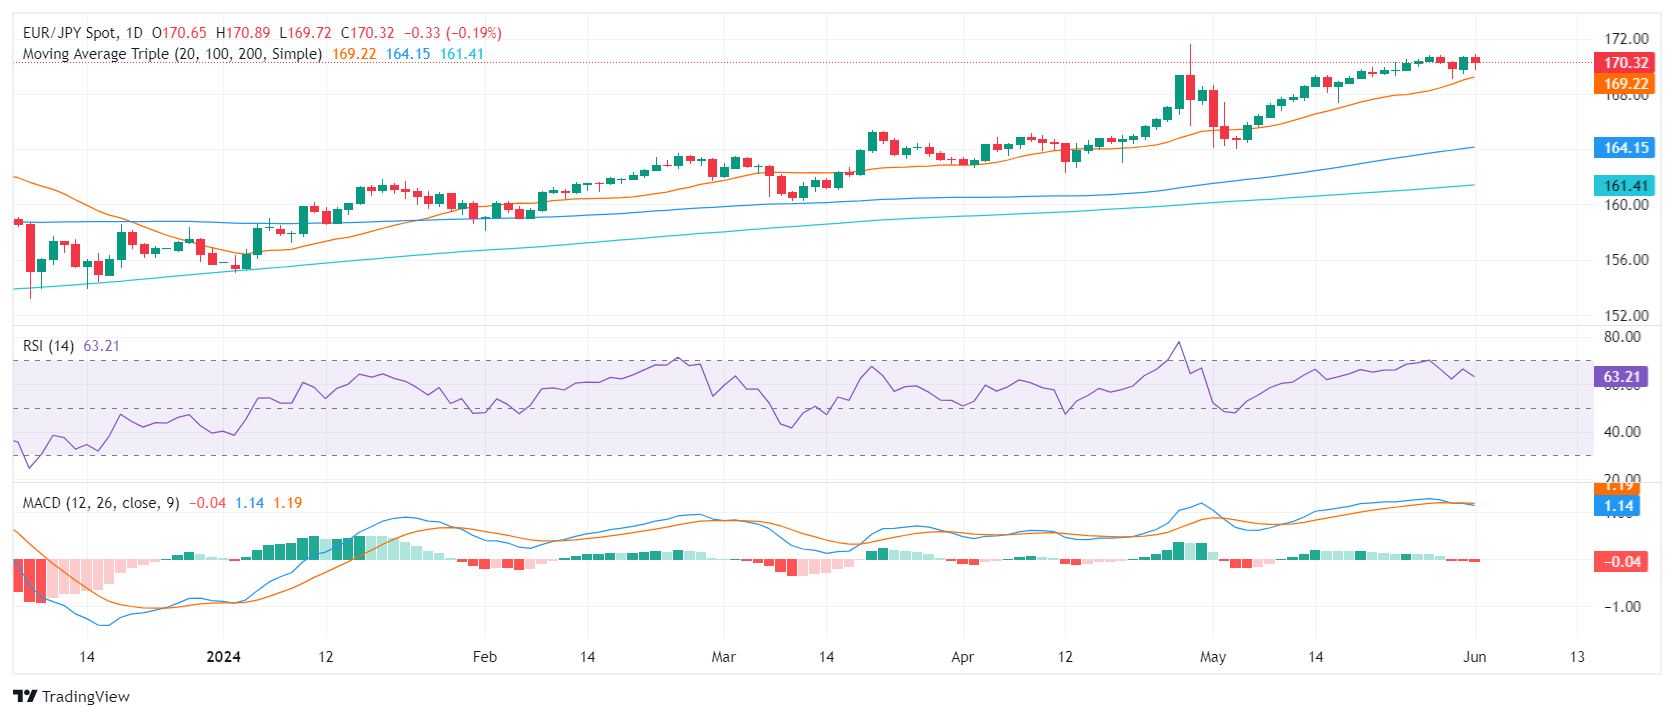
- The daily RSI has shifted downwards and with the MACD showing increasing red bars pointing to a slowdown in upward momentum.
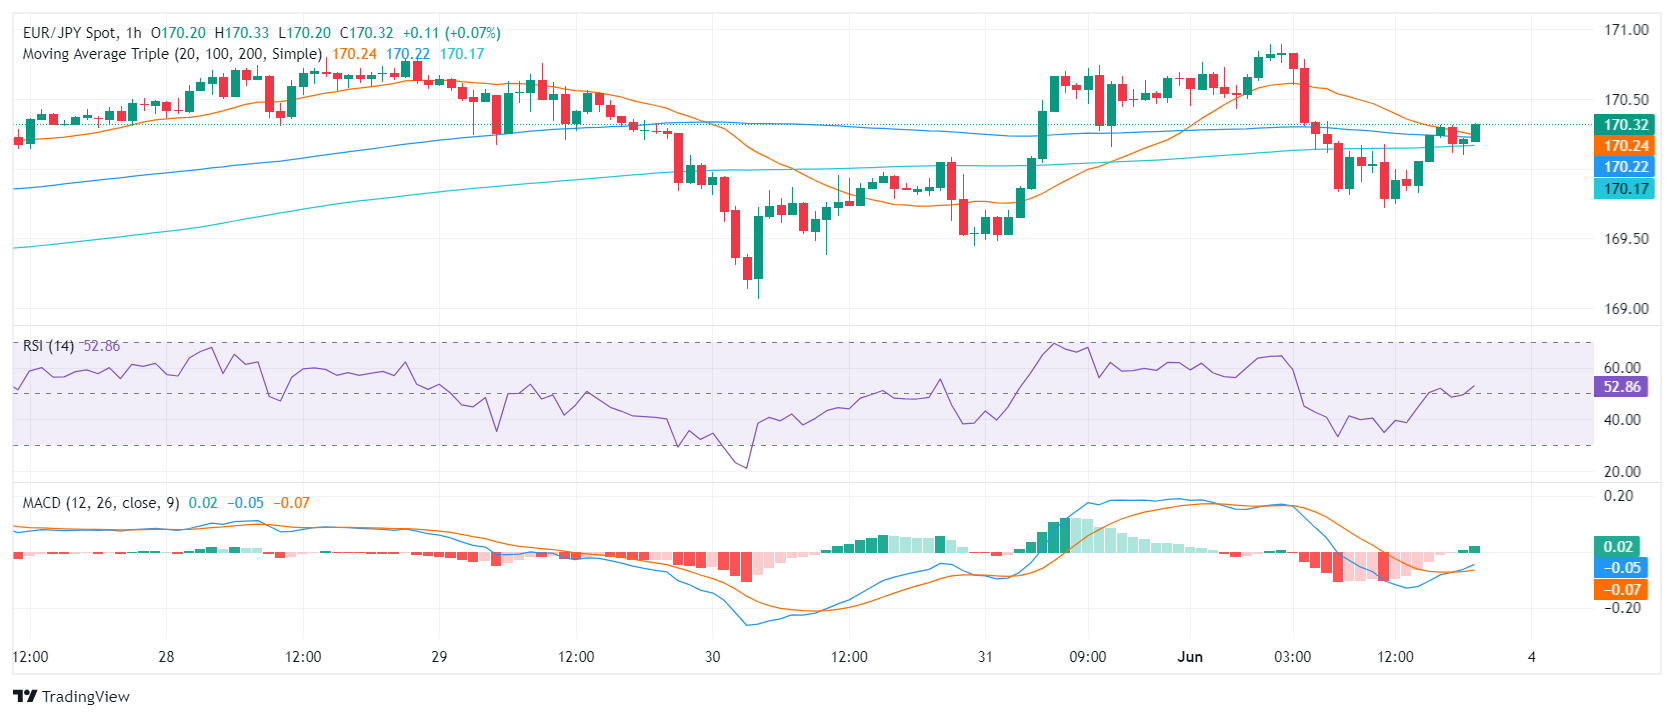
- On the hourly chart, indicators suggest moderate bullish momentum, supported by an increasing RSI and green bars in the MACD.
- The 20-day SMA at 169.22 serves as a critical support level for the pair to consolidate.
In Monday's session, a weak Yen against its rivals caused the EUR/JPY pair to slip to 170.30. Despite this slip, the pair's position remains solid above the key support level of the 20-day SMA at 169.22. However, as the pair currently hovers in overbought territory, the upside appears limited.
The daily Relative Strength Index (RSI) showed a reduction to 61, suggesting a potential slowdown in the pair's upward momentum. The daily MACD, with increasing red bars, agrees with this outlook..
EUR/JPY daily chart
On the hourly chart, the RSI suggests a moderate bullish momentum, standing at 51, marking a positive shift in the session. The hourly MACD, showing rising green bars, supports this short-term bullish sentiment. Nevertheless, because the pair is hovering in the overbought zone, the upward move may be short-lived.
EUR/JPY hourly chart
Meanwhile, the pair continues to trade above the significant support level of the 20-day Simple Moving Average (SMA). Should the position fall below this support level, sellers may meet further resistance at the 100 and 200-day SMAs, providing a safety barrier at around 164.00 and 161.00. As long as these support levels are defended, the overall bullish outlook remains intact, despite the possibility of consolidation. On the upside, the buyers must recapture the 167.00 area to continue moving upwards.


© 2000-2026. Bản quyền Teletrade.
Trang web này được quản lý bởi Teletrade D.J. LLC 2351 LLC 2022 (Euro House, Richmond Hill Road, Kingstown, VC0100, St. Vincent and the Grenadines).
Thông tin trên trang web không phải là cơ sở để đưa ra quyết định đầu tư và chỉ được cung cấp cho mục đích làm quen.
Giao dịch trên thị trường tài chính (đặc biệt là giao dịch sử dụng các công cụ biên) mở ra những cơ hội lớn và tạo điều kiện cho các nhà đầu tư sẵn sàng mạo hiểm để thu lợi nhuận, tuy nhiên nó mang trong mình nguy cơ rủi ro khá cao. Chính vì vậy trước khi tiến hành giao dịch cần phải xem xét mọi mặt vấn đề chấp nhận tiến hành giao dịch cụ thể xét theo quan điểm của nguồn lực tài chính sẵn có và mức độ am hiểu thị trường tài chính.
Sử dụng thông tin: sử dụng toàn bộ hay riêng biệt các dữ liệu trên trang web của công ty TeleTrade như một nguồn cung cấp thông tin nhất định. Việc sử dụng tư liệu từ trang web cần kèm theo liên kết đến trang teletrade.vn. Việc tự động thu thập số liệu cũng như thông tin từ trang web TeleTrade đều không được phép.
Xin vui lòng liên hệ với pr@teletrade.global nếu có câu hỏi.
ngân hàng