- Phân tích
- Tin tức và các công cụ
- Tin tức thị trường
- AUD/JPY Price Analysis: Bulls gather momentum, consolidation ongoing
AUD/JPY Price Analysis: Bulls gather momentum, consolidation ongoing
- Daily chart indicators suggest a positive incline; RSI climbs up.
- Hourly chart indicators flatten out in positive territory, indicating consolidation after recent gains.
- The pair is seeing signs of bullish exhaustion after recent gains, with eyes set on support around the 103.60-103.80 area.
In Friday's trading session, the AUD/JPY pair soared to the 104.50 region owing to positive momentum, reinforcing expectations of an overall bullish landscape. However, the market's upward trajectory is showing signs of fatigue, and the pair has entered in a consolidation phase.
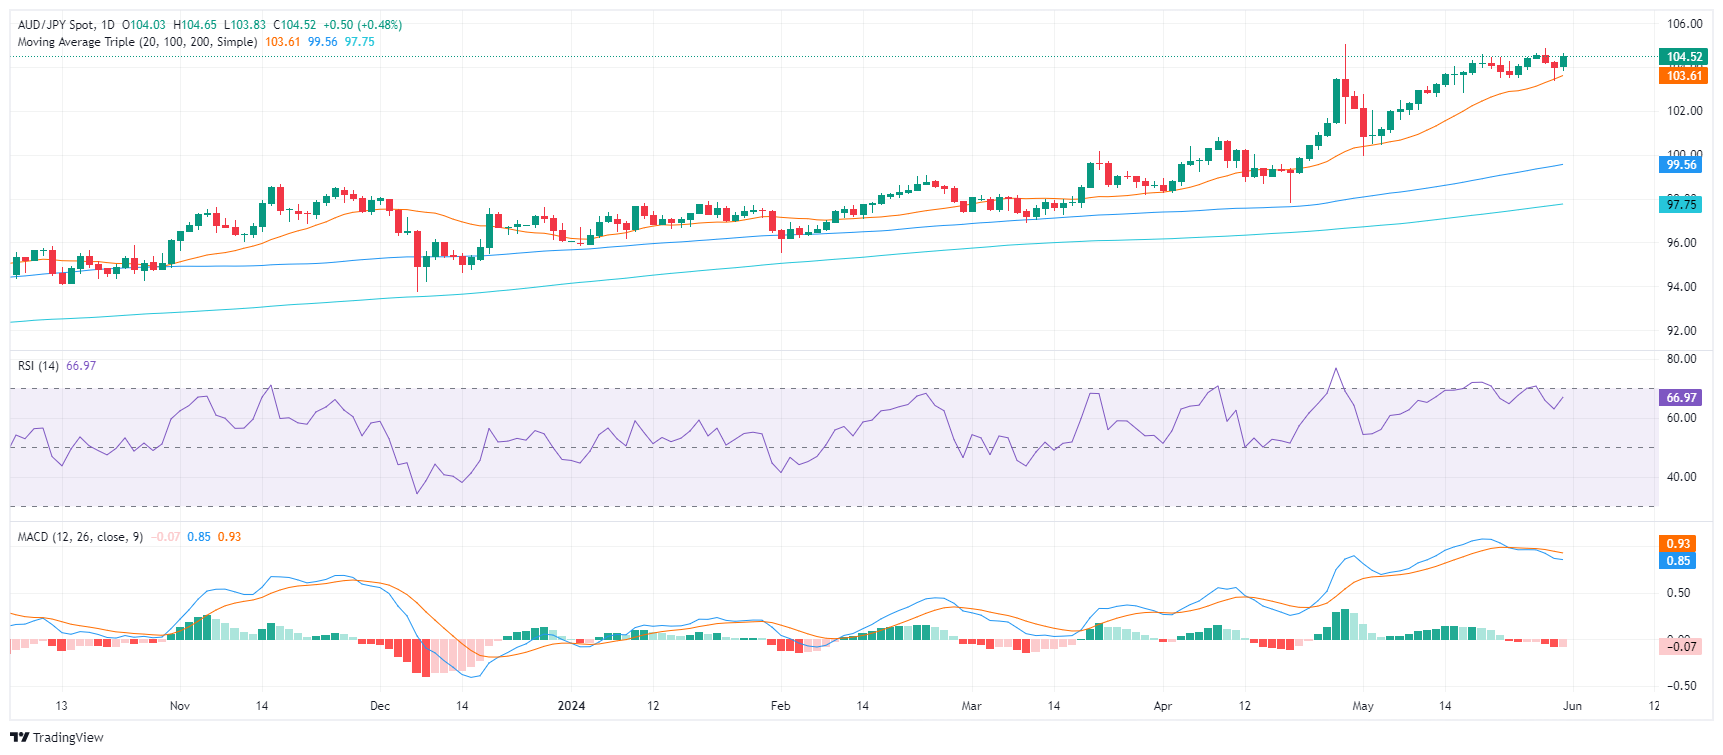
As per the daily chart, the RSI has ascended near to the 70 region, presenting a slight recovery from Wednesday's drop to 67, suggesting a potential halt to the previous downtrend. Corresponding with this, the MACD prints flat red bars, indicating a possible pause in the market's selling traction.
AUD/JPY daily chart
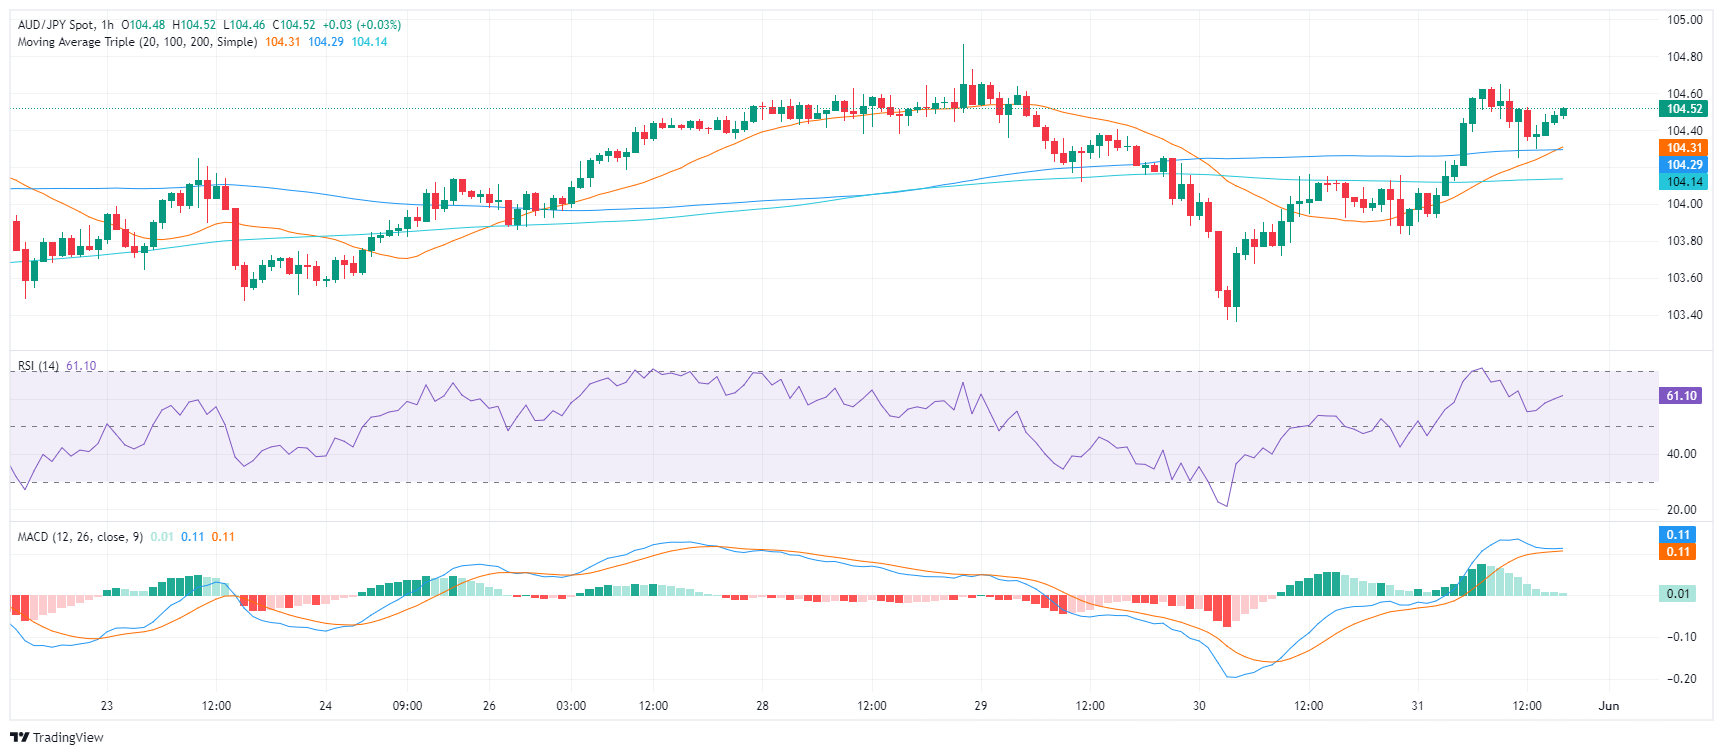
Confirming these dynamics is the hourly chart. The RSI and MACD are greener and have flattened, indicating a potential period of consolidation following the recent rally.
AUD/JPY hourly chart
In retrospect to the session on Thursday, sellers were repelled at the 20-day SMA mark of 103.60 and again on Friday at 103.80. These developments have set a formidable support base around that region, which appears could be leveraged to stabilize the recent gains. Any downturn below the 20-day SMA may risk undermining the short-term bullish atmosphere.


© 2000-2026. Bản quyền Teletrade.
Trang web này được quản lý bởi Teletrade D.J. LLC 2351 LLC 2022 (Euro House, Richmond Hill Road, Kingstown, VC0100, St. Vincent and the Grenadines).
Thông tin trên trang web không phải là cơ sở để đưa ra quyết định đầu tư và chỉ được cung cấp cho mục đích làm quen.
Giao dịch trên thị trường tài chính (đặc biệt là giao dịch sử dụng các công cụ biên) mở ra những cơ hội lớn và tạo điều kiện cho các nhà đầu tư sẵn sàng mạo hiểm để thu lợi nhuận, tuy nhiên nó mang trong mình nguy cơ rủi ro khá cao. Chính vì vậy trước khi tiến hành giao dịch cần phải xem xét mọi mặt vấn đề chấp nhận tiến hành giao dịch cụ thể xét theo quan điểm của nguồn lực tài chính sẵn có và mức độ am hiểu thị trường tài chính.
Sử dụng thông tin: sử dụng toàn bộ hay riêng biệt các dữ liệu trên trang web của công ty TeleTrade như một nguồn cung cấp thông tin nhất định. Việc sử dụng tư liệu từ trang web cần kèm theo liên kết đến trang teletrade.vn. Việc tự động thu thập số liệu cũng như thông tin từ trang web TeleTrade đều không được phép.
Xin vui lòng liên hệ với pr@teletrade.global nếu có câu hỏi.
ngân hàng