- Phân tích
- Tin tức và các công cụ
- Tin tức thị trường
- USD/CHF plummets following PCE data
USD/CHF plummets following PCE data
- USD/CHF took a downturn in Friday’s session, plummeting to 0.9016, after slightly rising to 0.9070 earlier in the session.
- Following US inflation figures coming in line with market expectations, markets may be anticipating a less aggressive Fed stance.
- The potential for rate cuts in September has increased slightly.
The USD/CHF pair is trading lower following the release of the latest US inflation data on Friday. This change came in despite inflation figures, signaled by the Personal Consumption Expenditures (PCE) Price Index, holding steady at 2.7% YoY in April which matched market expectations.
On the other hand, the Core PCE Price Index, excluding volatile food and energy prices, observed a 2.8% YoY rise, consistent with the analyst's estimate. What seems to be weakening the USD is the lower-than-expected monthly variation of 0.2% which was below the 0.3% expected. The odds for easing by the Federal Reserve (Fed), however, remained mostly unchanged, except for a slight increase in the likelihood of the first-rate cut occurring in September. Those probabilities remain low for June and July.
USD/CHF technical analysis
In the daily analysis, the Relative Strength Index (RSI) has plunged into negative territory, indicating a momentum shift that favors sellers for the time being. Simultaneously, the Moving Average Convergence Divergence (MACD) displays red bars, pointing toward a growing bearish momentum.
USD/CHF daily chart
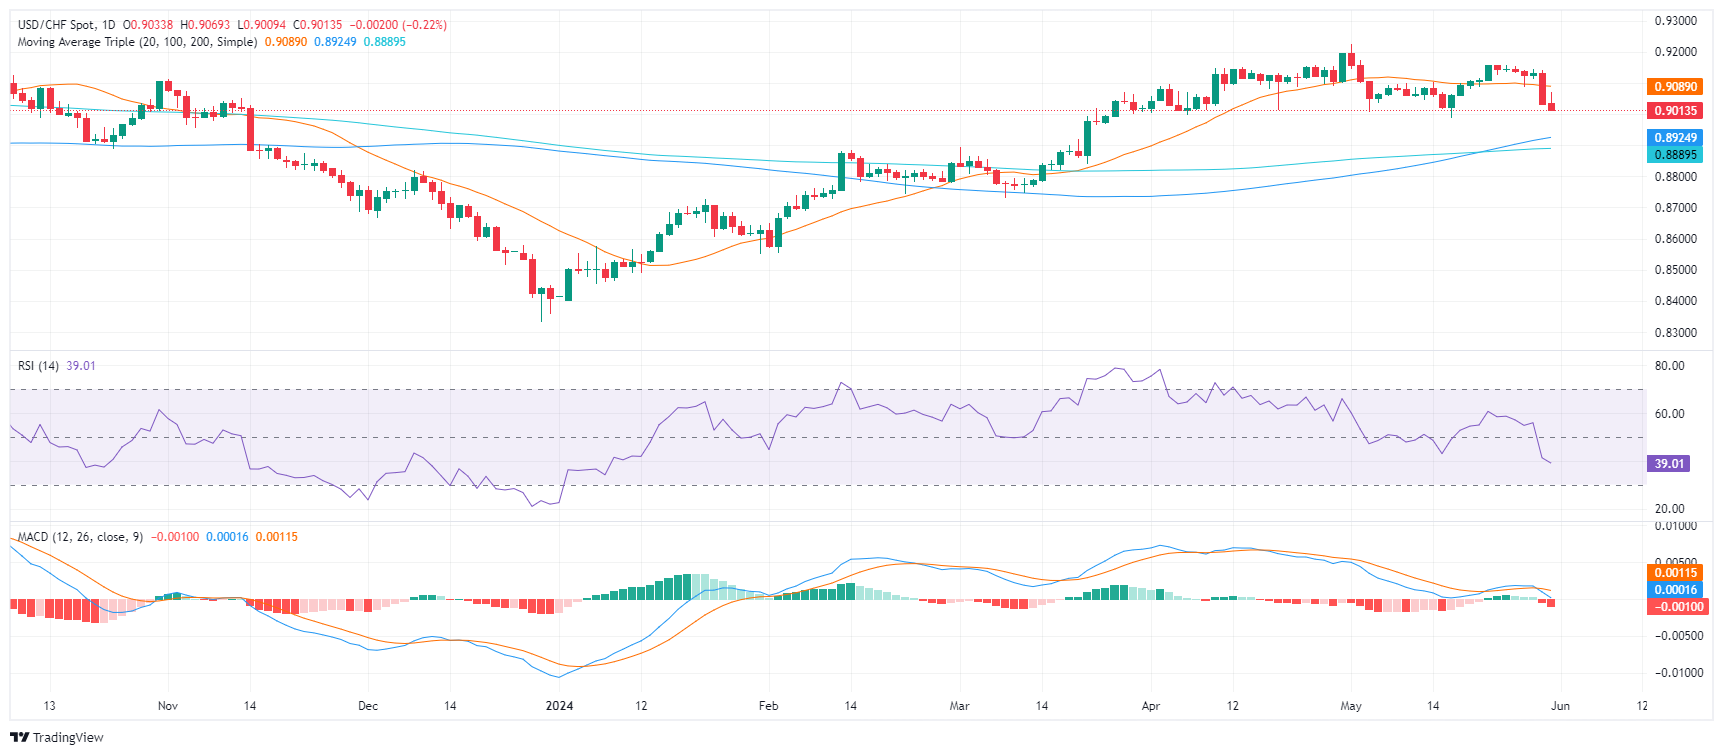
The USD/CHF seems to have lost some of its sheen from earlier in the week, when it stayed above the 20, 100, and 200-day Simple Moving Averages (SMAs). This previous positioning was a strong indicator of a bullish trend, with market dominance leaning towards buyers. However, following the recent downturn, the pair has lost its position above the 20-day SMA at 0.9095, indicating a less positive short-term outlook.


© 2000-2026. Bản quyền Teletrade.
Trang web này được quản lý bởi Teletrade D.J. LLC 2351 LLC 2022 (Euro House, Richmond Hill Road, Kingstown, VC0100, St. Vincent and the Grenadines).
Thông tin trên trang web không phải là cơ sở để đưa ra quyết định đầu tư và chỉ được cung cấp cho mục đích làm quen.
Giao dịch trên thị trường tài chính (đặc biệt là giao dịch sử dụng các công cụ biên) mở ra những cơ hội lớn và tạo điều kiện cho các nhà đầu tư sẵn sàng mạo hiểm để thu lợi nhuận, tuy nhiên nó mang trong mình nguy cơ rủi ro khá cao. Chính vì vậy trước khi tiến hành giao dịch cần phải xem xét mọi mặt vấn đề chấp nhận tiến hành giao dịch cụ thể xét theo quan điểm của nguồn lực tài chính sẵn có và mức độ am hiểu thị trường tài chính.
Sử dụng thông tin: sử dụng toàn bộ hay riêng biệt các dữ liệu trên trang web của công ty TeleTrade như một nguồn cung cấp thông tin nhất định. Việc sử dụng tư liệu từ trang web cần kèm theo liên kết đến trang teletrade.vn. Việc tự động thu thập số liệu cũng như thông tin từ trang web TeleTrade đều không được phép.
Xin vui lòng liên hệ với pr@teletrade.global nếu có câu hỏi.
ngân hàng