- Phân tích
- Tin tức và các công cụ
- Tin tức thị trường
- AUD/USD Price Analysis: Up leg within sideways trend approaches ceiling
AUD/USD Price Analysis: Up leg within sideways trend approaches ceiling
- AUD/USD is unfolding an up leg within a range which is approaching the range highs.
- If it reaches the highs the pair could reverse and begin a move south, extending the sideways trend.
- A clear breakout above the range highs or lows would be required to give the pair directionality again.
AUD/USD trades about a half of a percent higher in the 0.6660s on Friday as the pair continues rising following a bounce from the May 24 swing lows.
The pair has probably entered a sideways trend and since “the trend is your friend” this range-bound market mode is likely to extend. The range the Aussie finds itself trading in appears to have a high at the May 26 high of 0.6680 and a floor at 0.6591 (May 30 low).
AUD/USD 4-hour Chart
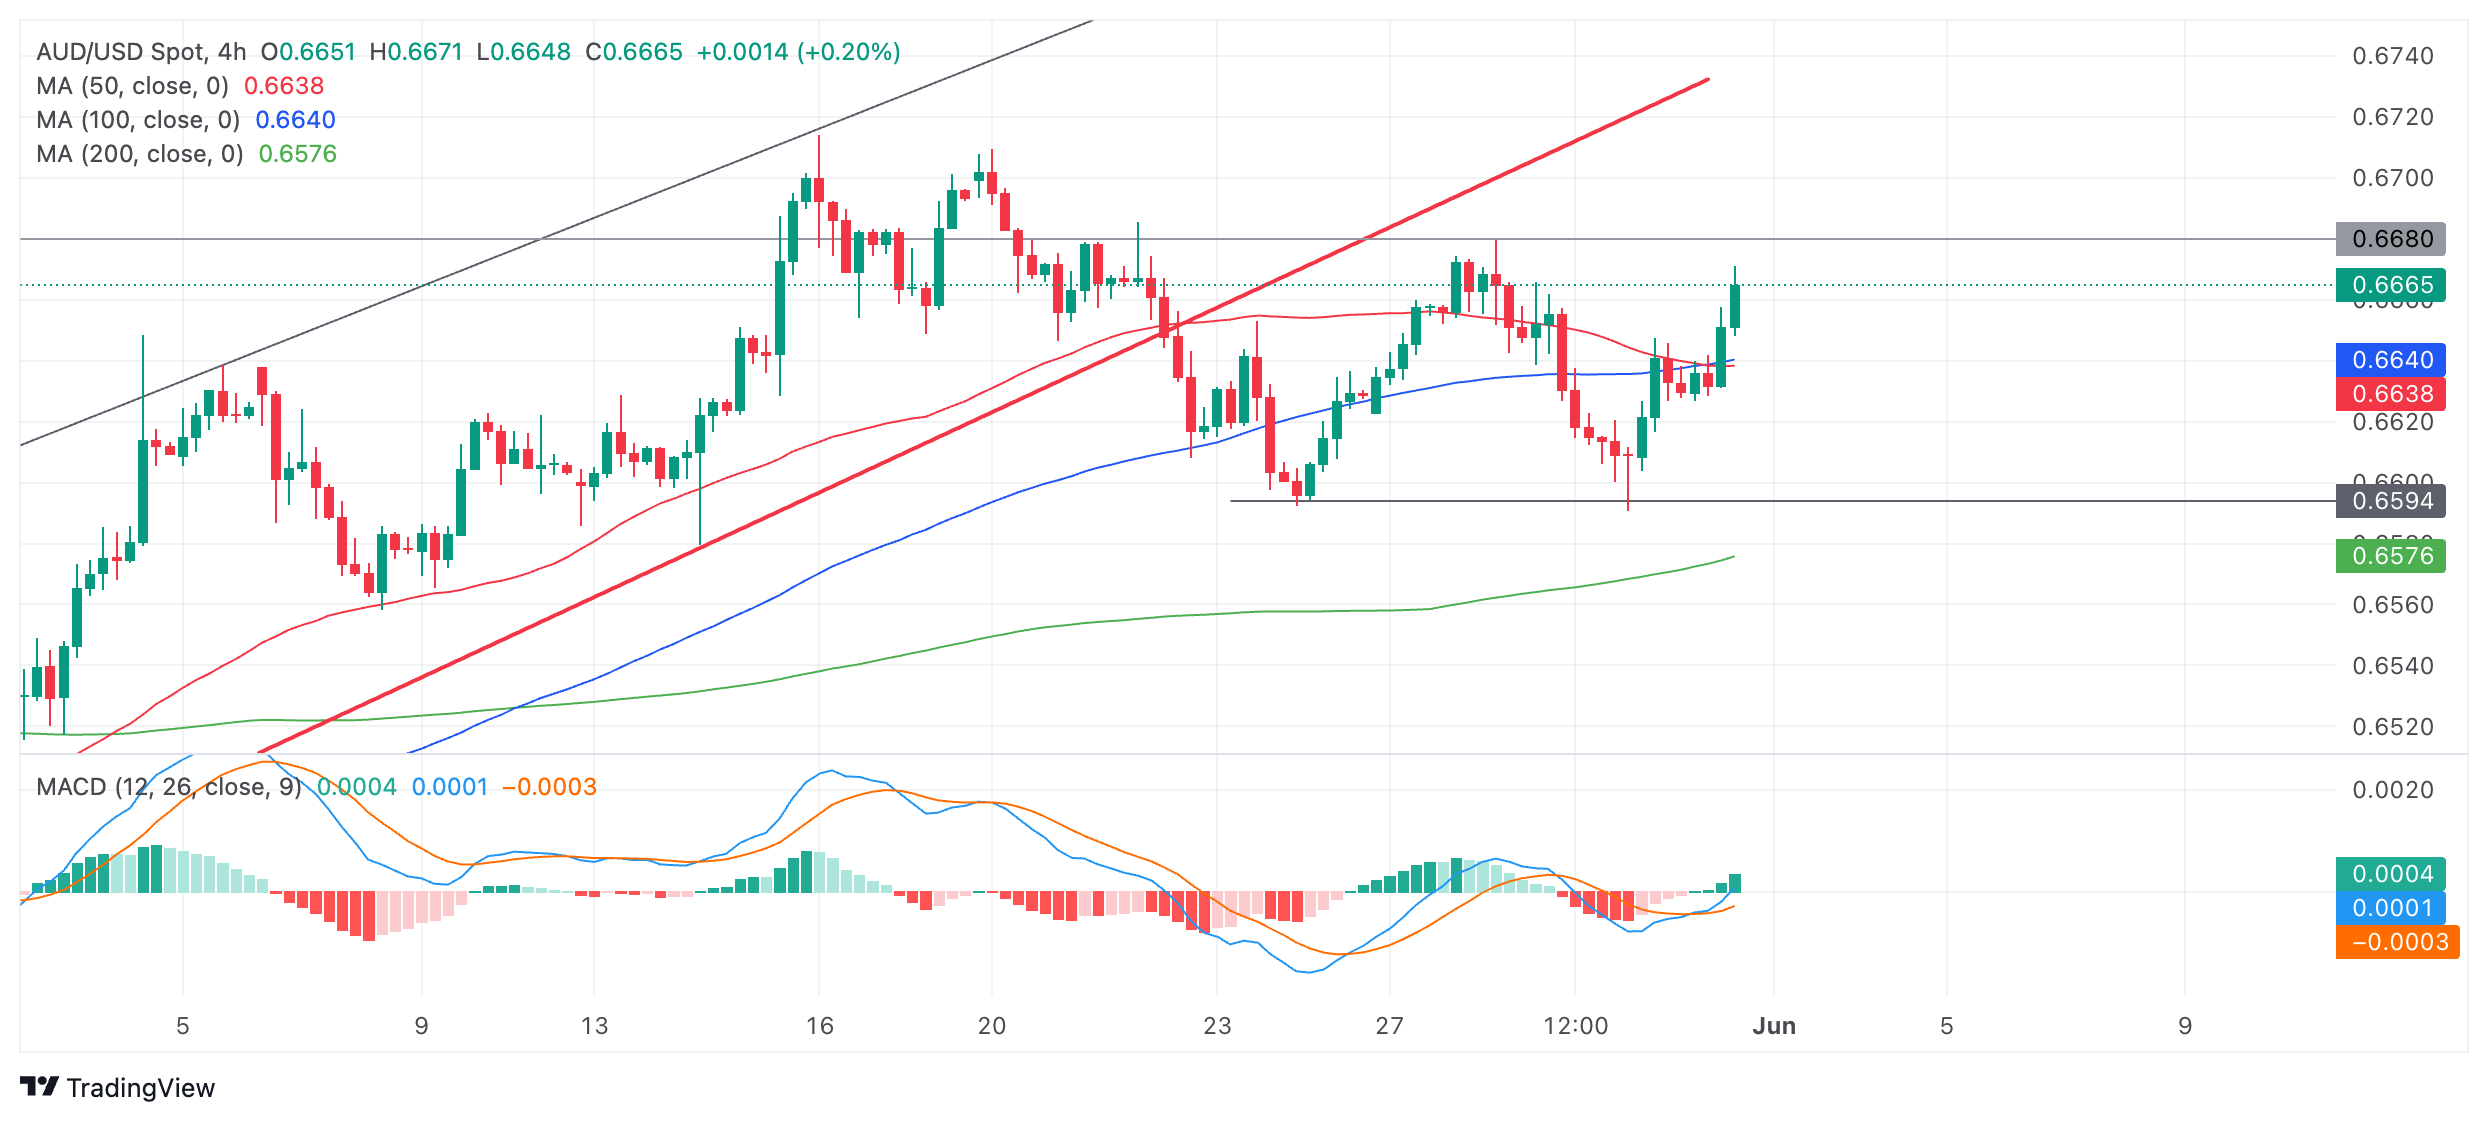
The current leg up within the range could reach the range ceiling at 0.6680 before reversing and starting a down leg to the range floor.
The Moving Average Convergence Divergence (MACD) momentum indicator has crossed above its red signal line, giving a buy signal and supporting the move higher.
If AUD/USD reaches the range highs or close to them and then rolls over and forms a Japanese candlestick reversal pattern it could be a sign the pair is extending its sideways trend and a leg down is about to begin.
A MACD cross back below the signal line – especially if in positive territory – would add further evidence to suggest a move down within the narrow range was evolving.
Failed breakdown
AUD/USD broke down from its rising channel on May 22, bringing the established uptrend into doubt. Follow-through lower was weak, however, and the pair soon found its feet. There is no clear short-term directional trend suggesting the trend may actually be sideways.
It would require a decisive break below 0.6591 to confirm more downside, with the next target probably at 0.6560 where the 100 and 50-day SMAs are located (not shown).
Alternatively, a decisive break above the range ceiling would reassert the bullish bias and probably lead to 0.6714 (May 14 high).
Decisive breaks are accompanied by long candles that break through the level and close near their high or low or three consecutive candles that pierce the level in question and are all of the same color (red for a bearish decisive break and green for bullish).


© 2000-2026. Bản quyền Teletrade.
Trang web này được quản lý bởi Teletrade D.J. LLC 2351 LLC 2022 (Euro House, Richmond Hill Road, Kingstown, VC0100, St. Vincent and the Grenadines).
Thông tin trên trang web không phải là cơ sở để đưa ra quyết định đầu tư và chỉ được cung cấp cho mục đích làm quen.
Giao dịch trên thị trường tài chính (đặc biệt là giao dịch sử dụng các công cụ biên) mở ra những cơ hội lớn và tạo điều kiện cho các nhà đầu tư sẵn sàng mạo hiểm để thu lợi nhuận, tuy nhiên nó mang trong mình nguy cơ rủi ro khá cao. Chính vì vậy trước khi tiến hành giao dịch cần phải xem xét mọi mặt vấn đề chấp nhận tiến hành giao dịch cụ thể xét theo quan điểm của nguồn lực tài chính sẵn có và mức độ am hiểu thị trường tài chính.
Sử dụng thông tin: sử dụng toàn bộ hay riêng biệt các dữ liệu trên trang web của công ty TeleTrade như một nguồn cung cấp thông tin nhất định. Việc sử dụng tư liệu từ trang web cần kèm theo liên kết đến trang teletrade.vn. Việc tự động thu thập số liệu cũng như thông tin từ trang web TeleTrade đều không được phép.
Xin vui lòng liên hệ với pr@teletrade.global nếu có câu hỏi.
ngân hàng