- Phân tích
- Tin tức và các công cụ
- Tin tức thị trường
- Gold recovers on slower US growth
Gold recovers on slower US growth
- Gold recovers after the release of the second estimate for US Q1 GDP data showed the economy expanded less than previously anticipated.
- A slowing economy reduces inflation and interest-rate expectations, supporting non-yielding Gold.
- Yet Gold remains technically vulnerable after a breakout from the Bear Flag continuation pattern.
Gold (XAU/USD) trades flat in the $2,340s on Friday, pausing in its labored recovery from Thursday’s three-week trough about $20 lower.
The recovery came after the release of weaker US growth data, which suggested inflation will remain contained and interest rates are more likely to come down. As a non-yielding asset, the expectation of lower interest rates is a positive for Gold.
Gold recovers after US growth slows
Gold rebounded on Thursday after the second estimate of US first-quarter GDP growth showed a downward revision to an annualized 1.3% from 1.6% in the first estimate.
The slower growth came from lower consumer spending, which in turn is expected to keep inflation contained, and the Federal Reserve (Fed) on track to lower interest rates. In a reflection of changing expectations after the GDP release, the US 10-year Treasury Note yield dropped back to 4.55% from a four-week peak of 4.63%.
Markets have been entertaining the possibility the Fed might even increase interest rates. However, commentary from several Fed officials on Thursday threw this idea out of the bag:
- Bank of Atlanta Fed President Raphael Bostic noted that he did not believe further rate hikes should be required to reach the Fed's 2.0% annual inflation target.
- Bank of Chicago Fed President Austan Goolsbee noted that while housing inflation was still "well elevated" making it hard to get to 2.0%, he was “Still optimistic that housing inflation will slow.”
- Bank of New York Fed President John Williams said that he believed Fed policy was well positioned to slowly get price growth back to the Fed's 2.0% annual target.
US Personal Consumption Expenditure (PCE) data for April, out on Friday, could impact interest-rate expectations further, in turn influencing Gold price. PCE is the Federal Reserve’s preferred gauge of inflation so it tends to carry more heft. Although, as several analysts have noted, the release is quite predictable, coming as it does after the CPI and PPI releases for the same month. That said, small deviations from expectations could still generate volatility.
The probabilities of the Fed cutting interest rates before September are insignificant and are hanging in the balance at 50/50 in September, data from the CME FedWatch Tool shows.
Gold and Asian demand as a currency hedge
US interest-rate expectations are not the only factor influencing the Gold price, according to Daniel Ghali, a Senior Commodity Strategist at TD Securities.
Ghali’s research shows that Gold demand is being driven by Asian buyers who are hoarding the precious metal as a hedge as their currencies depreciate against a strengthening US Dollar (USD).
“Precious metals are acting as a currency depreciation hedge. Case in point: fund flows into Chinese gold ETFs are rising once more at their fastest pace since the massive buying activity observed in April. US yields are surging, the dollar broke out of its lull, and yet precious metals prices have remained extremely resilient,” says Ghali.
This suggests the strength of the US Dollar may not be as negatively correlated to Gold as it was in the past, and Gold prices could be capped in the event of an appreciation of USD.
Technical Analysis: Gold poised for weakness after breakout from Bear Flag
Gold price has broken out of a slanted rectangular formation (red-shaded area), probably a Bear Flag continuation price pattern which formed between May 24 and 27.
The breakout activates the Bear Flag’s downside target zone of between $2,303 and $2,295. A break below Thursday’s $2,322 lows would provide further bearish confirmation.
XAU/USD 4-hour Chart
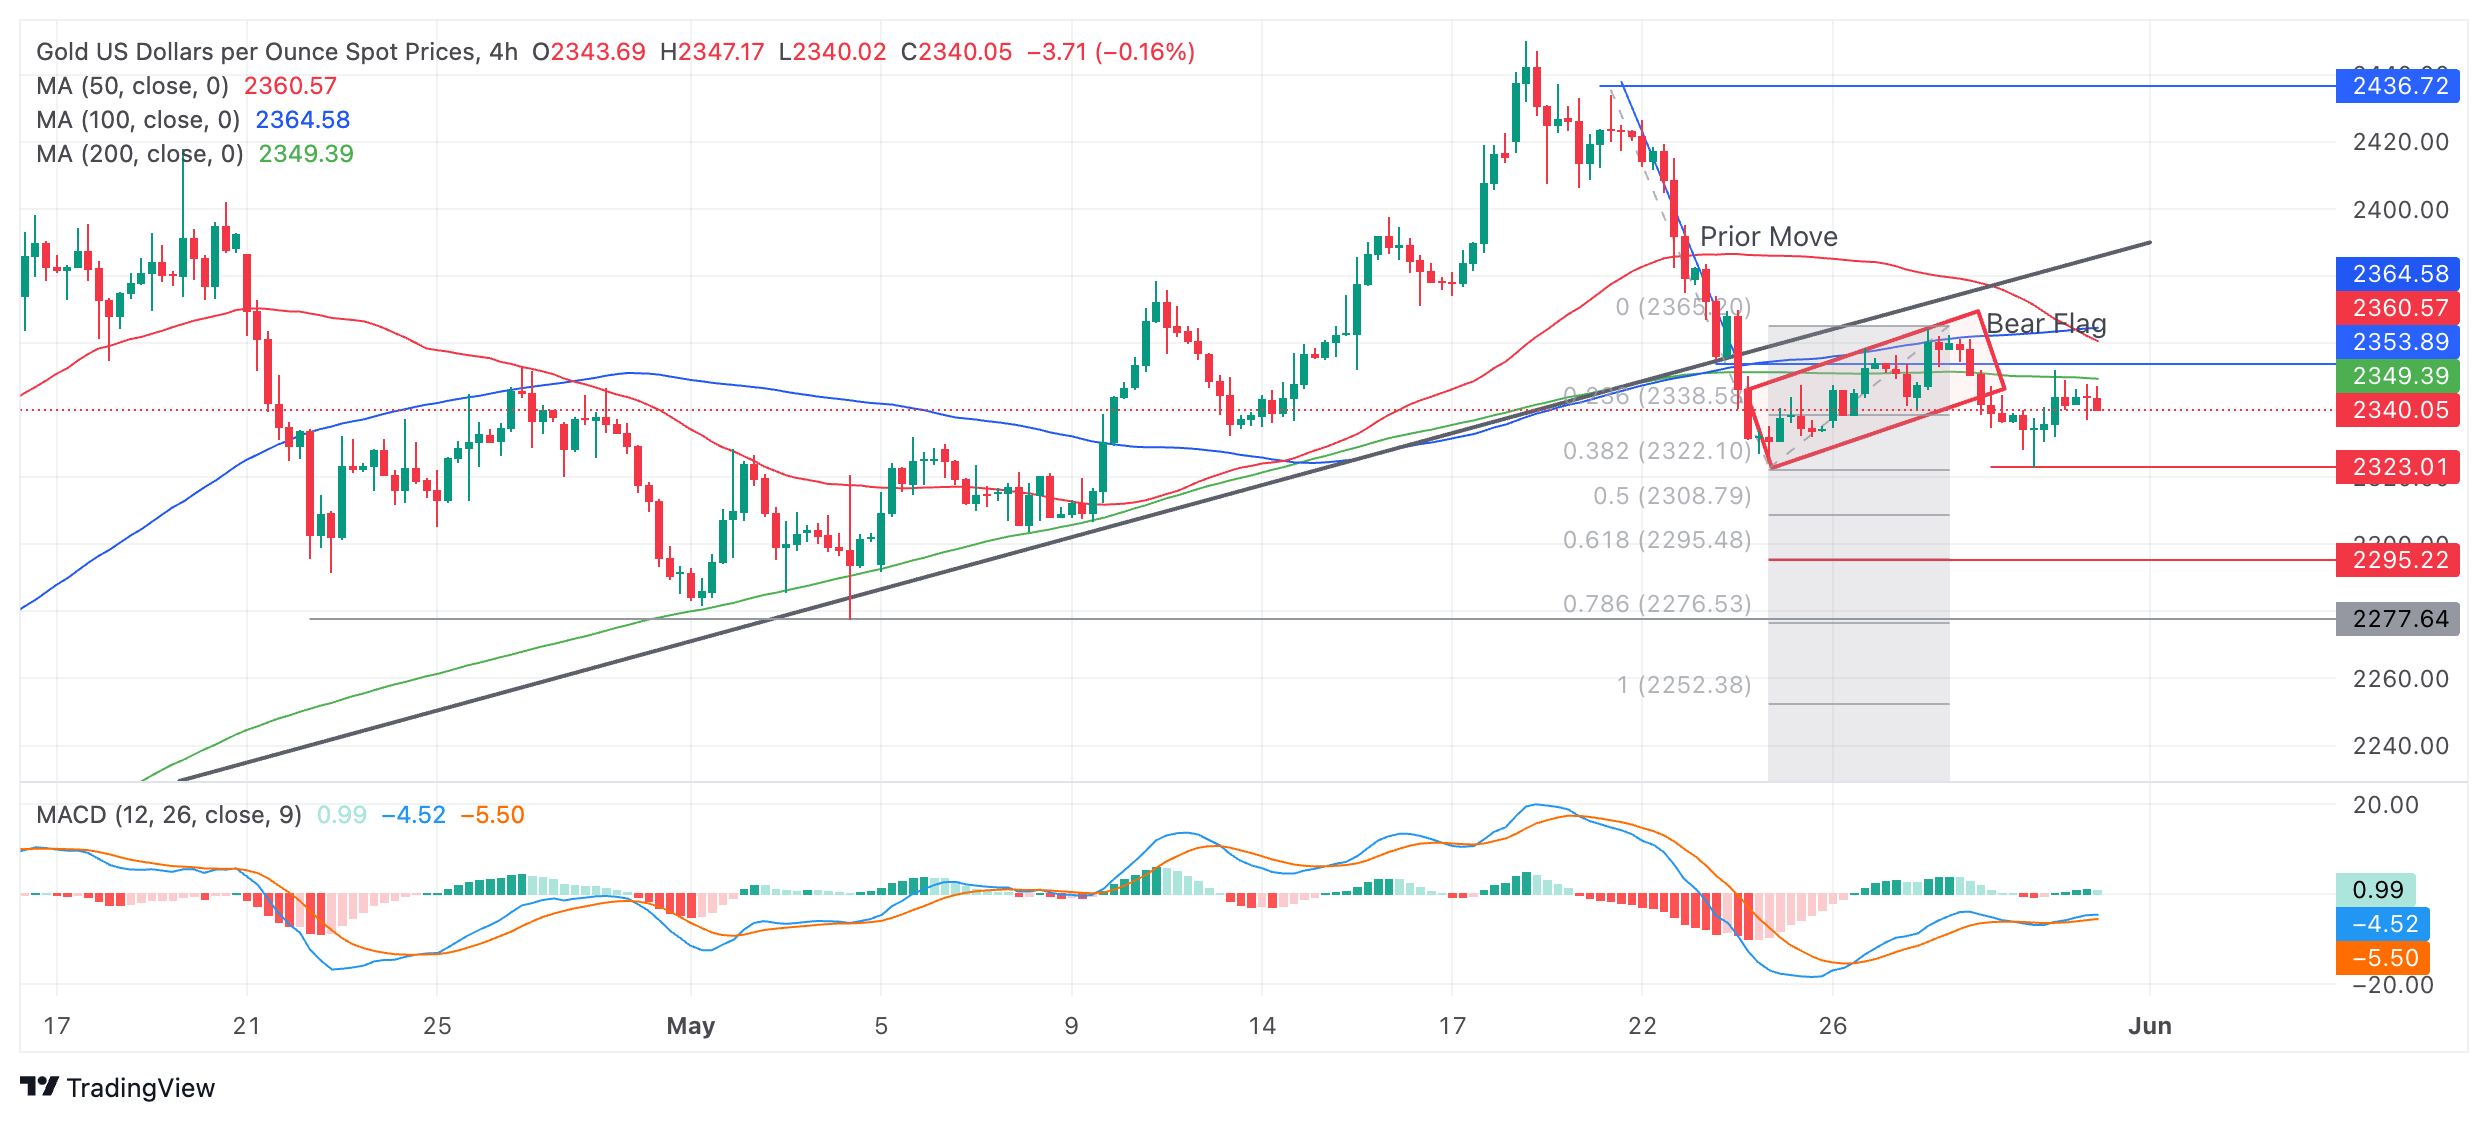
Bear Flags look like upside-down flags composed of a sharp decline – the flagpole – and the consolidation phase or “flag square”.
A more bearish move could even see Gold fall to $2,272-$2,277 (the 100% extrapolation of the move prior to the trend-line break and historic support and resistance).
Gold's 4-hour chart, used to assess the short-term trend, now exhibits a sequence of declining peaks and troughs, suggesting it is in a short-term downtrend and favoring short positions over longs.
The precious metal’s medium and long-term trends are still bullish, however, suggesting the risk of a recovery remains high. That said, price action is not supporting a resumption hypothesis at the moment.
A decisive break back above the trendline, now at around $2,385, would be required to provide evidence of a recovery and reversal of the short-term downtrend.
A decisive break would be one accompanied by a long green bullish candle or three green candles in a row.
Economic Indicator
Core Personal Consumption Expenditures - Price Index (YoY)
The Core Personal Consumption Expenditures (PCE), released by the US Bureau of Economic Analysis on a monthly basis, measures the changes in the prices of goods and services purchased by consumers in the United States (US). The PCE Price Index is also the Federal Reserve’s (Fed) preferred gauge of inflation. The YoY reading compares the prices of goods in the reference month to the same month a year earlier. The core reading excludes the so-called more volatile food and energy components to give a more accurate measurement of price pressures." Generally, a high reading is bullish for the US Dollar (USD), while a low reading is bearish.
Read more.Next release: Fri May 31, 2024 12:30
Frequency: Monthly
Consensus: 2.8%
Previous: 2.8%
Source: US Bureau of Economic Analysis
After publishing the GDP report, the US Bureau of Economic Analysis releases the Personal Consumption Expenditures (PCE) Price Index data alongside the monthly changes in Personal Spending and Personal Income. FOMC policymakers use the annual Core PCE Price Index, which excludes volatile food and energy prices, as their primary gauge of inflation. A stronger-than-expected reading could help the USD outperform its rivals as it would hint at a possible hawkish shift in the Fed’s forward guidance and vice versa.


© 2000-2026. Bản quyền Teletrade.
Trang web này được quản lý bởi Teletrade D.J. LLC 2351 LLC 2022 (Euro House, Richmond Hill Road, Kingstown, VC0100, St. Vincent and the Grenadines).
Thông tin trên trang web không phải là cơ sở để đưa ra quyết định đầu tư và chỉ được cung cấp cho mục đích làm quen.
Giao dịch trên thị trường tài chính (đặc biệt là giao dịch sử dụng các công cụ biên) mở ra những cơ hội lớn và tạo điều kiện cho các nhà đầu tư sẵn sàng mạo hiểm để thu lợi nhuận, tuy nhiên nó mang trong mình nguy cơ rủi ro khá cao. Chính vì vậy trước khi tiến hành giao dịch cần phải xem xét mọi mặt vấn đề chấp nhận tiến hành giao dịch cụ thể xét theo quan điểm của nguồn lực tài chính sẵn có và mức độ am hiểu thị trường tài chính.
Sử dụng thông tin: sử dụng toàn bộ hay riêng biệt các dữ liệu trên trang web của công ty TeleTrade như một nguồn cung cấp thông tin nhất định. Việc sử dụng tư liệu từ trang web cần kèm theo liên kết đến trang teletrade.vn. Việc tự động thu thập số liệu cũng như thông tin từ trang web TeleTrade đều không được phép.
Xin vui lòng liên hệ với pr@teletrade.global nếu có câu hỏi.
ngân hàng