- Phân tích
- Tin tức và các công cụ
- Tin tức thị trường
- EUR/USD Price Analysis: The first upside target emerges above 1.0850
EUR/USD Price Analysis: The first upside target emerges above 1.0850
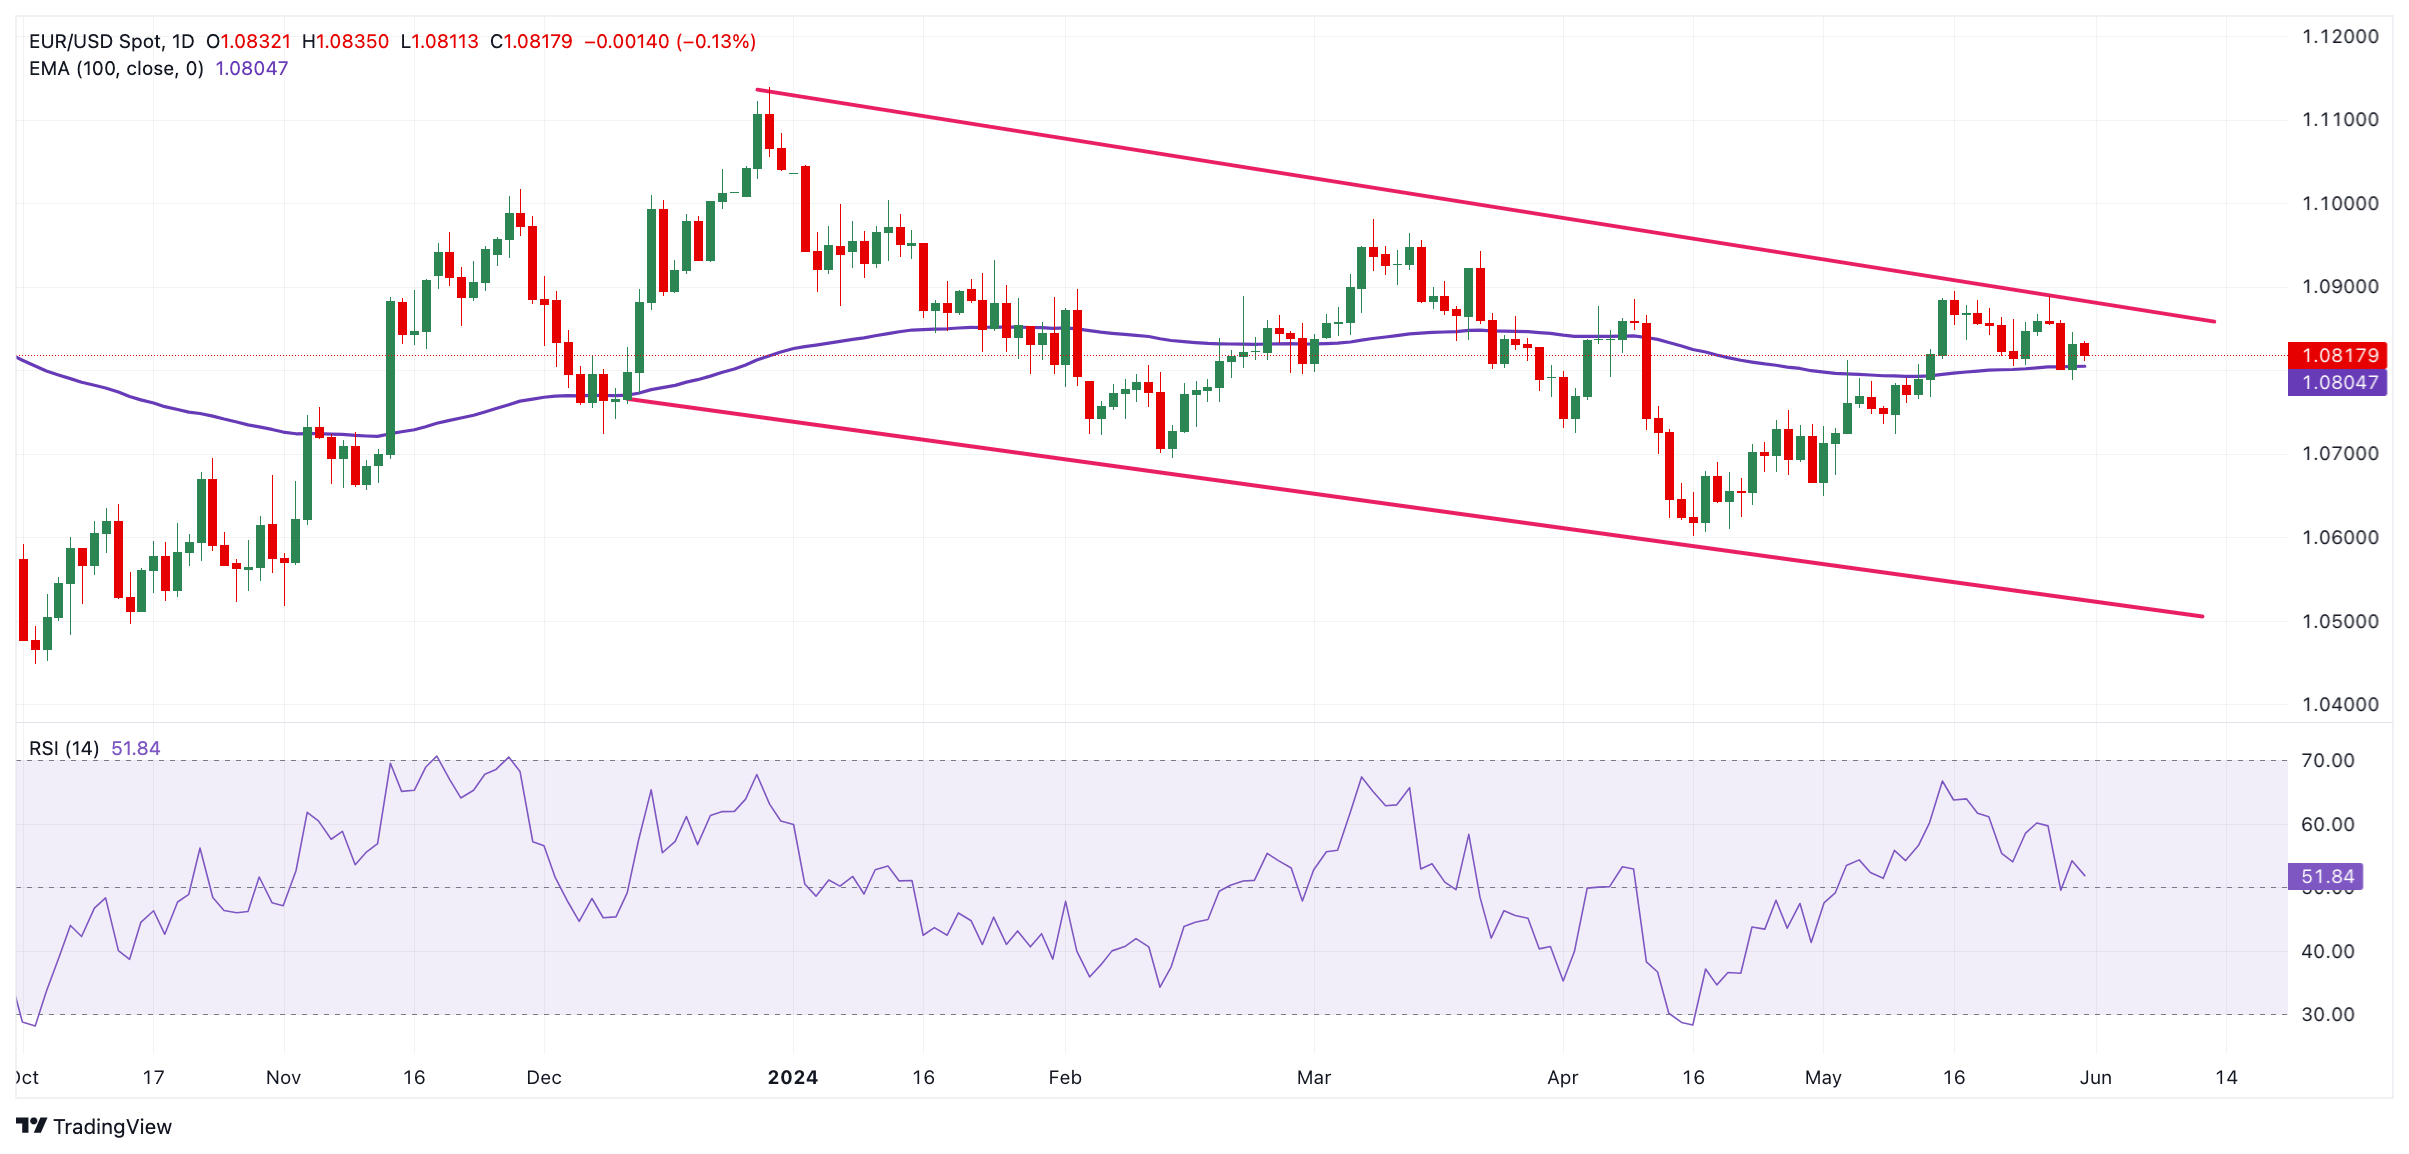
- EUR/USD drifts lower near 1.0820 in Friday’s early European session.
- The bullish outlook of the pair remains intact above the 100-day EMA on the daily timeframe.
- The immediate resistance level will emerge at 1.0875; the first downside target is seen in the 1.0800-1.0805 zone.
The EUR/USD pair weakens to 1.0820 during the early European trading hours on Friday. Investors prefer to wait on the sidelines ahead of the German Retail Sales and the US Core Personal Consumption Expenditures Price Index (Core PCE) data, which are due later on Friday. The markets expect the Core PCE Price Index inflation to show an increase of 2.8% for the year ended in April and the monthly Core PCE inflation to increase 0.3%.
According to the daily chart, EUR/USD remained capped within a descending trend channel since mid-December 2023. The major pair keeps the bullish vibe unchanged as it holds above the key 100-day Exponential Moving Average (EMA). Nonetheless, the 14-day Relative Strength Index (RSI) remains flat around the 50-midline, indicating that further consolidation looks favorable.
The upper boundary of the descending trend channel 1.0875 acts as an immediate resistance level for the major pair. A break above the latter will see a rally to a high of March 21 at 1.0943 en route to a high of March 8 at 1.0981, and finally the 1.1000 psychological level.
On the flip side, the first downside target for EUR/USD will emerge at the 1.0800-1.0805 region, portraying the confluence of the 100-day EMA and psychological level. The additional downside filter to watch is a low of April 2 at 1.0724, followed by a low of May 2 at 1.0650, and finally a low of April 16 at 1.0600.
EUR/USD daily chart


© 2000-2026. Bản quyền Teletrade.
Trang web này được quản lý bởi Teletrade D.J. LLC 2351 LLC 2022 (Euro House, Richmond Hill Road, Kingstown, VC0100, St. Vincent and the Grenadines).
Thông tin trên trang web không phải là cơ sở để đưa ra quyết định đầu tư và chỉ được cung cấp cho mục đích làm quen.
Giao dịch trên thị trường tài chính (đặc biệt là giao dịch sử dụng các công cụ biên) mở ra những cơ hội lớn và tạo điều kiện cho các nhà đầu tư sẵn sàng mạo hiểm để thu lợi nhuận, tuy nhiên nó mang trong mình nguy cơ rủi ro khá cao. Chính vì vậy trước khi tiến hành giao dịch cần phải xem xét mọi mặt vấn đề chấp nhận tiến hành giao dịch cụ thể xét theo quan điểm của nguồn lực tài chính sẵn có và mức độ am hiểu thị trường tài chính.
Sử dụng thông tin: sử dụng toàn bộ hay riêng biệt các dữ liệu trên trang web của công ty TeleTrade như một nguồn cung cấp thông tin nhất định. Việc sử dụng tư liệu từ trang web cần kèm theo liên kết đến trang teletrade.vn. Việc tự động thu thập số liệu cũng như thông tin từ trang web TeleTrade đều không được phép.
Xin vui lòng liên hệ với pr@teletrade.global nếu có câu hỏi.
ngân hàng