- Phân tích
- Tin tức và các công cụ
- Tin tức thị trường
- NZD/JPY Price Analysis: Bullish momentum adjusts, correction begins following overbought signals
NZD/JPY Price Analysis: Bullish momentum adjusts, correction begins following overbought signals
- The daily chart continues to flash overbought signals despite a slight correction, with the overall uptrend still intact.
- Despite a minor dip to 96.40, NZD/JPY remains near its multi-year peak.
- The critical support level for the pair remains firmly at 95.00, marking a pivotal level to ward off losses.
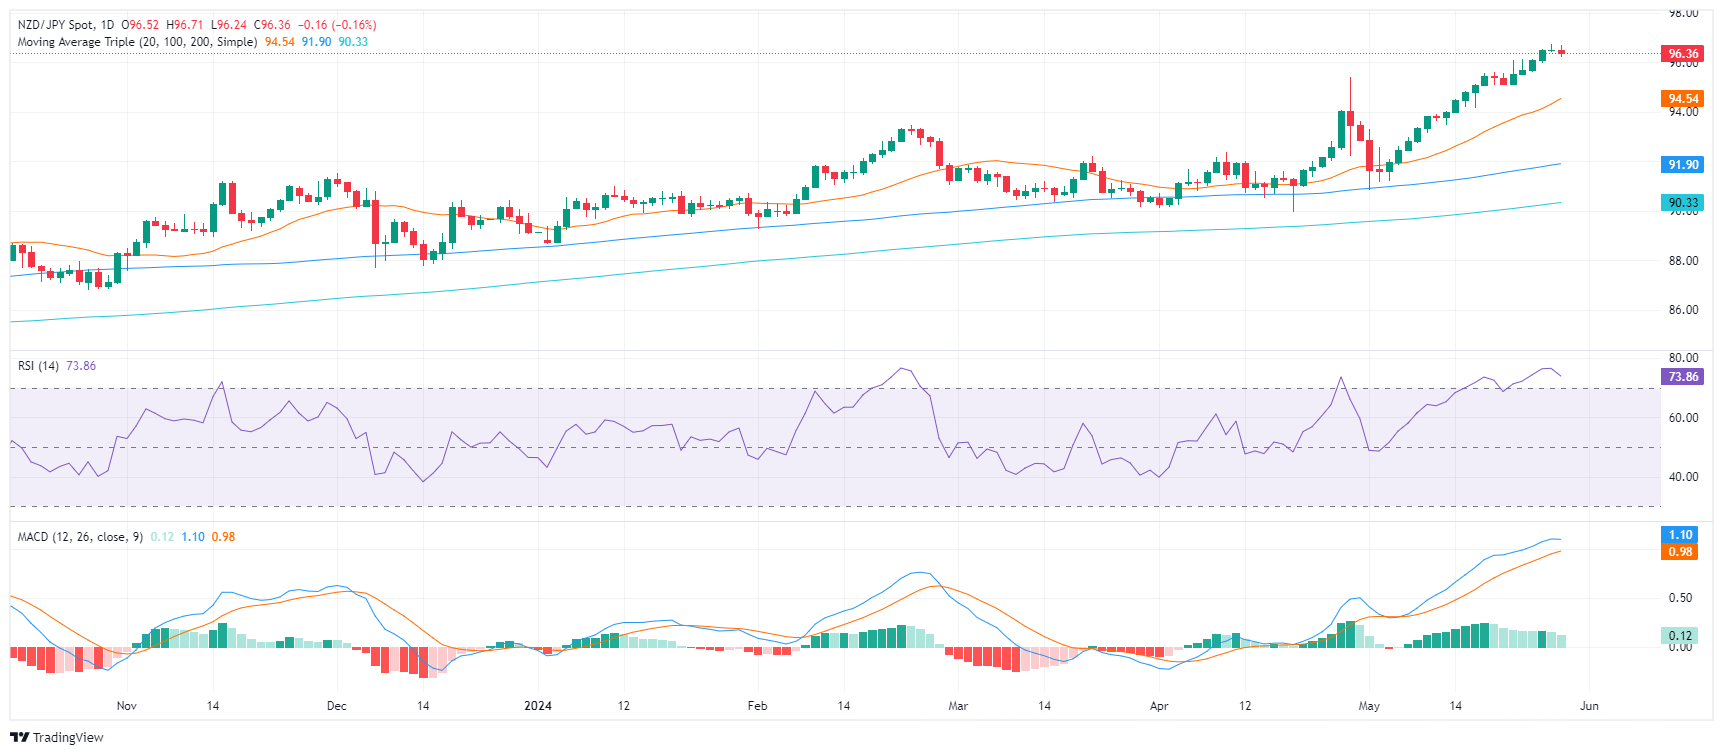
In Wednesday's session, the NZD/JPY pair saw a small correction to 96.40 but remains at its highest level since July 2007 at around 96.70. This adjustment doesn't quite alter the current outlook, merely turning it slightly cautious given the persistent overbought signals, but the overarching bullish trend carries on.
The daily chart's indicators confirm this narrative where the Relative Strength Index (RSI) remains in a deep overbought condition. Meanwhile, the Moving Average Convergence Divergence (MACD) keeps showing sustained positive momentum with its consistent green bars.
NZD/JPY daily chart
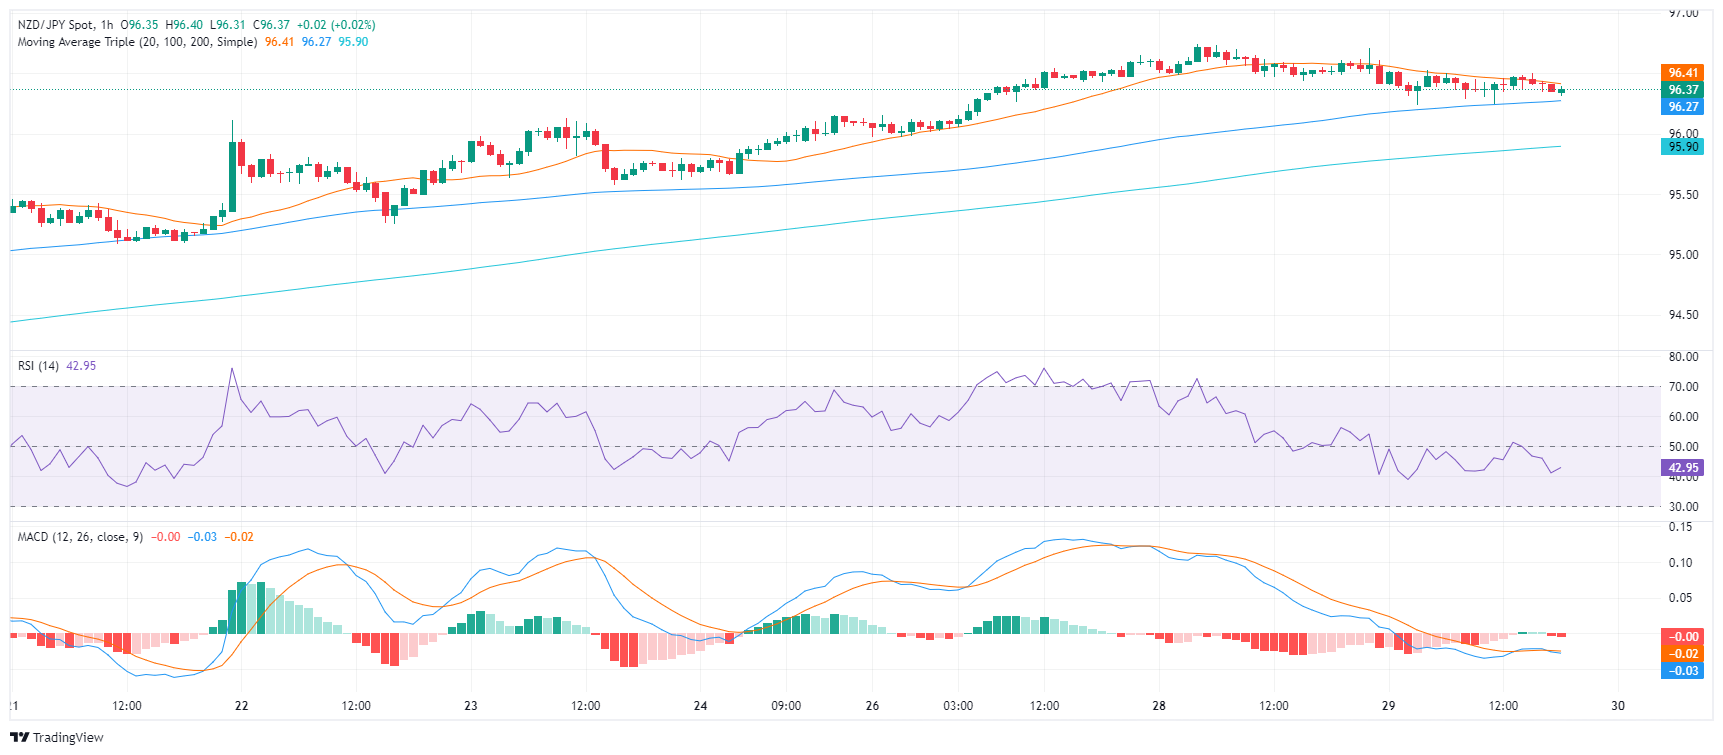
On the hourly chart, there is a visible weakening of strength compared to the daily perspective, and an ongoing edging downward can be observed.
NZD/JPY hourly chart
In a broader context, the NZD/JPY continues to display a strong uptrend, as shown by its position above the 20, 100, and 200-day Simple Moving Averages (SMA). Despite the slight correction, the pair's short-term gains still overshadow its medium and long-term averages.
As the looming correction gains momentum, any further downward movements should ideally keep the pair above its SMAs. Crucial to the monitoring is the first strong support level observed at 95.00, which the pair could potentially use to cushion any significant losses.


© 2000-2026. Bản quyền Teletrade.
Trang web này được quản lý bởi Teletrade D.J. LLC 2351 LLC 2022 (Euro House, Richmond Hill Road, Kingstown, VC0100, St. Vincent and the Grenadines).
Thông tin trên trang web không phải là cơ sở để đưa ra quyết định đầu tư và chỉ được cung cấp cho mục đích làm quen.
Giao dịch trên thị trường tài chính (đặc biệt là giao dịch sử dụng các công cụ biên) mở ra những cơ hội lớn và tạo điều kiện cho các nhà đầu tư sẵn sàng mạo hiểm để thu lợi nhuận, tuy nhiên nó mang trong mình nguy cơ rủi ro khá cao. Chính vì vậy trước khi tiến hành giao dịch cần phải xem xét mọi mặt vấn đề chấp nhận tiến hành giao dịch cụ thể xét theo quan điểm của nguồn lực tài chính sẵn có và mức độ am hiểu thị trường tài chính.
Sử dụng thông tin: sử dụng toàn bộ hay riêng biệt các dữ liệu trên trang web của công ty TeleTrade như một nguồn cung cấp thông tin nhất định. Việc sử dụng tư liệu từ trang web cần kèm theo liên kết đến trang teletrade.vn. Việc tự động thu thập số liệu cũng như thông tin từ trang web TeleTrade đều không được phép.
Xin vui lòng liên hệ với pr@teletrade.global nếu có câu hỏi.
ngân hàng